
Ultra-realistic City Economic Simulation
The City Economic Simulation DLC replaces the base game’s city model with one built for depth — a metropolis whose growth and prosperity you can read, and change, in detail.
What the simulation models
| Factor | What it covers |
|---|---|
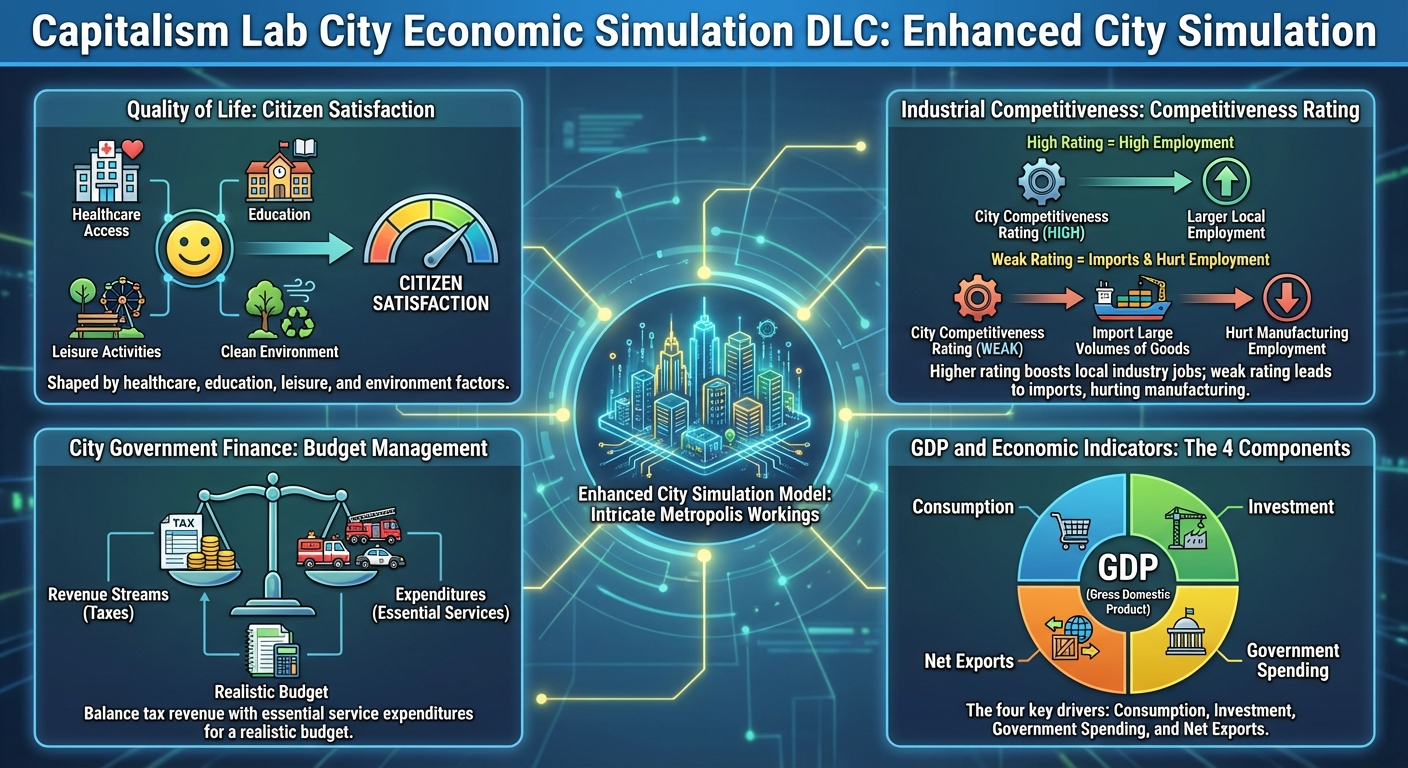
| Quality of life | Citizen satisfaction, shaped by access to healthcare, education, leisure and a clean environment. |
| Industrial competitiveness | The city’s strength in each industry, measured against a global benchmark. |
| City government finance | A real budget — tax revenue on one side, the cost of essential services on the other. |
| GDP and economic indicators | Detailed GDP breakdowns showing what each sector and industry contributes. |
| Tax system | Tax policy you set, and its effect on satisfaction, business profitability and economic activity. |
A refined city scale
The model’s depth costs computation, so city populations run at roughly one-tenth of the base game — around 500,000 people. What you lose in headline numbers you gain in the simulation of individual citizens and their behavior.
Supply and demand across retail, manufacturing, farming and natural resources were recalibrated for the smaller scale, so the game plays as a balanced challenge rather than a scaled-down one.
The City Report
Open it from the Information Center. It is organized into the pages below, each covering one aspect of the city’s performance.
City Graphs 1
| Graph | What it shows |
|---|---|
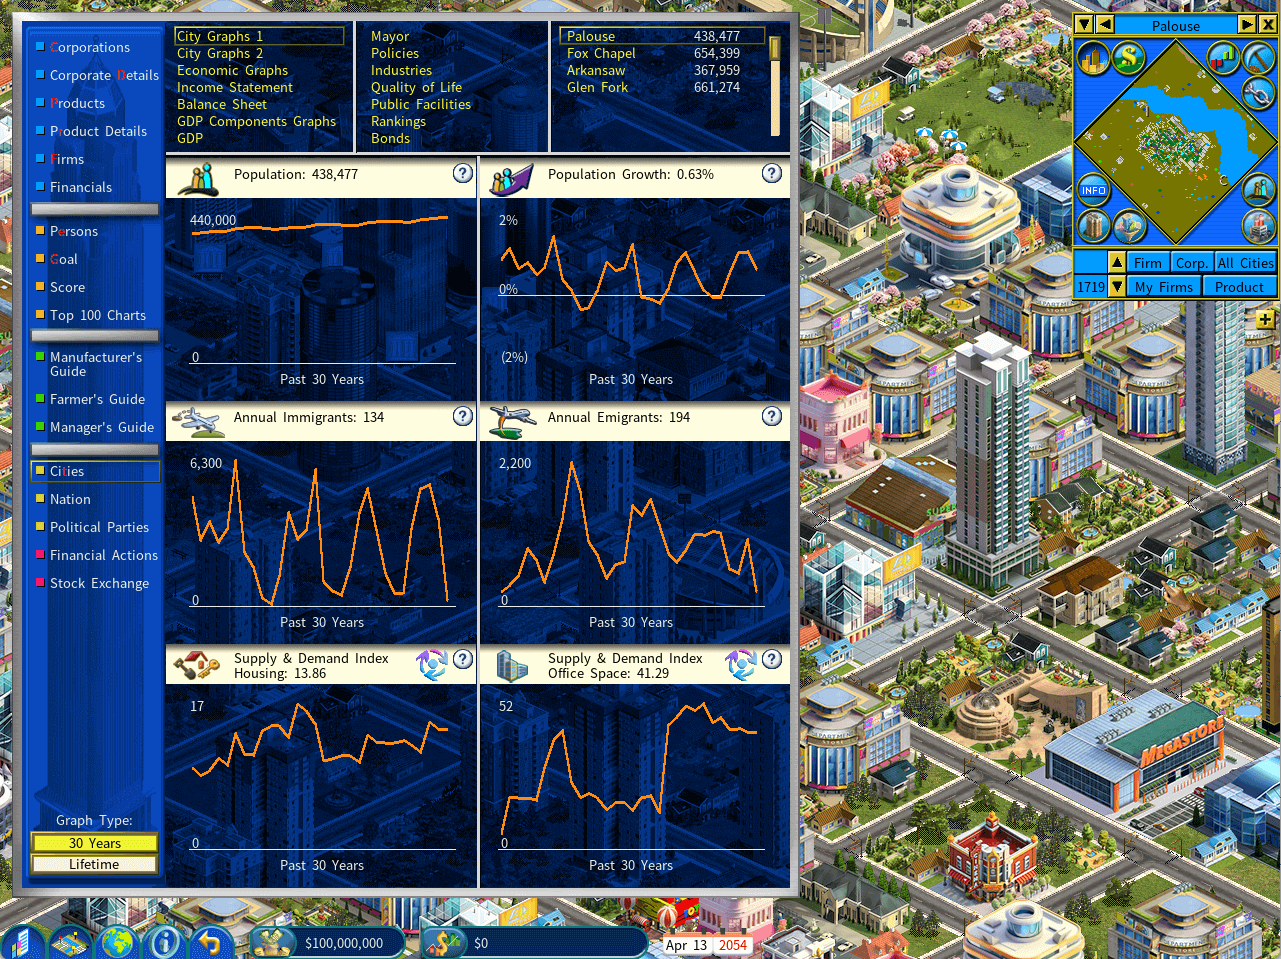
| City population | Population over time. Growth is supported by a low unemployment rate, a high quality of living, and enough new apartments. |
| Annual immigrants | People moving into the city each year. |
| Annual emigrants | People leaving the city each year. |
| Housing supply and demand index | Positive means supply exceeds demand; negative means the reverse. |
| Office space supply and demand index | The same measure for office space. |
City Graphs 2
| Graph | What it shows |
|---|---|
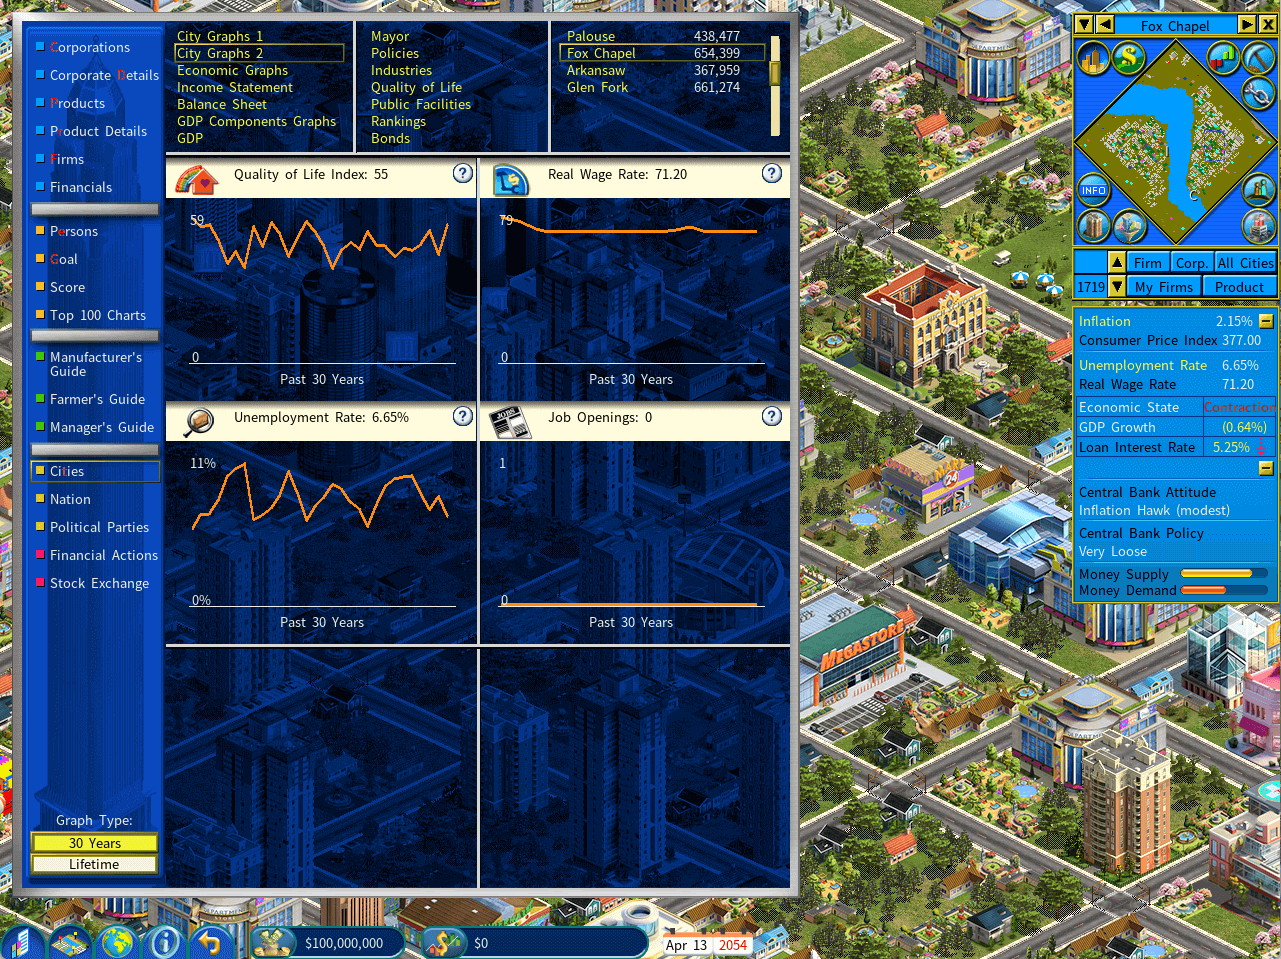
| Quality of living | People live better in apartments with good access to community and sports facilities, a green environment and shopping convenience — and with a higher real wage rate. |
| Unemployment rate | Trends lower when GDP growth is healthy and private companies are expanding and hiring. |
| Job openings | With plenty of openings, the city can afford to accept immigrants faster. |
Economic Graphs
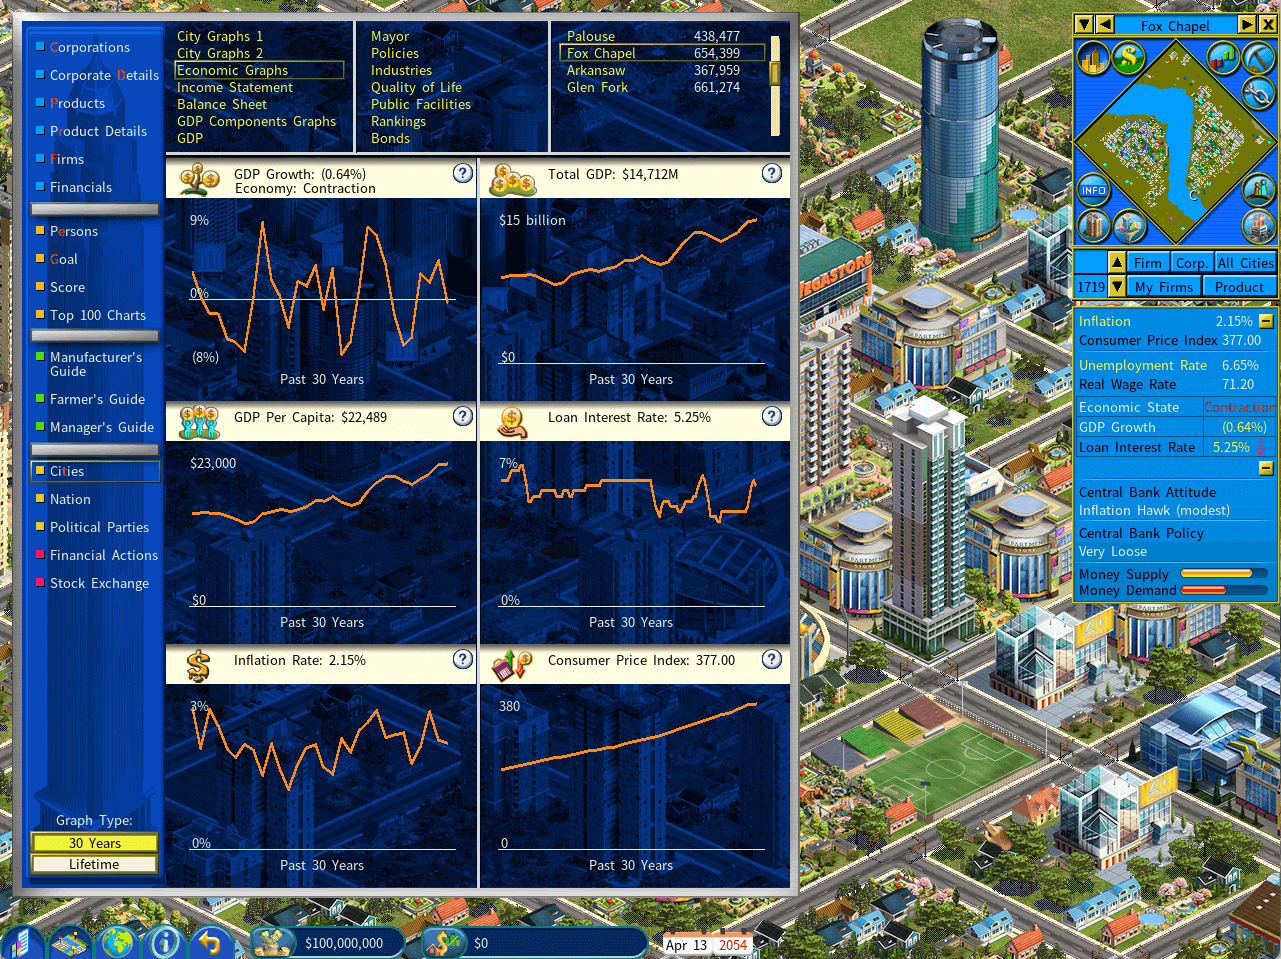
| Graph | What it shows |
|---|---|
| GDP growth | Driven by consumer spending, private investment, government spending and net exports. |
| Total GDP | The sum of those same four components. |
| GDP per capita | Total GDP divided by population — roughly, the value of goods produced per person. |
| Wage rate | A rising rate means people are earning more. |
| Inflation rate | Affected by the unemployment rate (the unemployed spend less) and by money supply and demand (a higher money supply promotes spending). |
| Purchasing power | Shown instead of inflation when Inverse Inflation is enabled. It is what a unit of currency buys — inflation erodes it. |
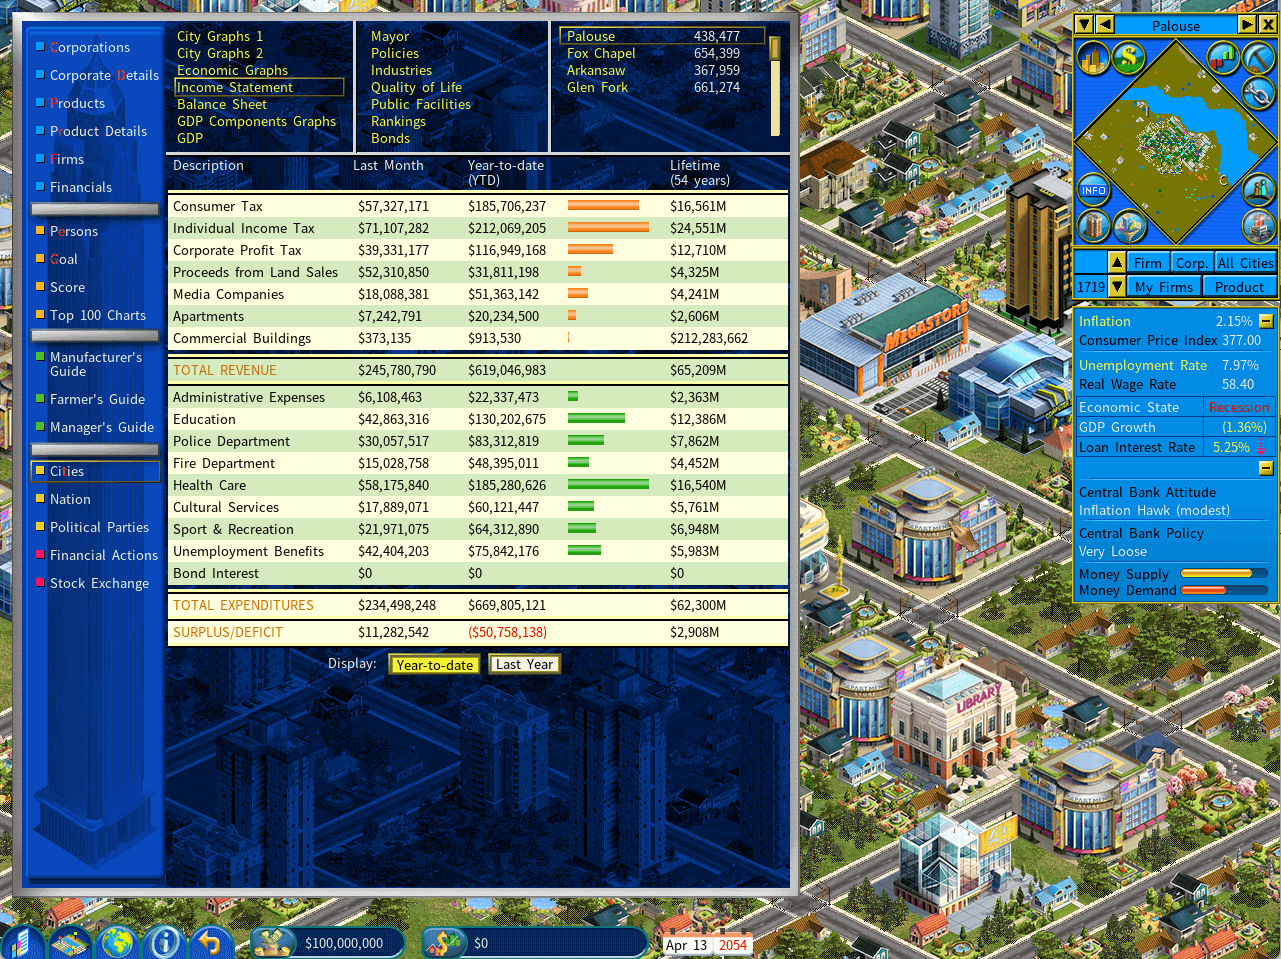
Income Statement
The income statement of the city government.
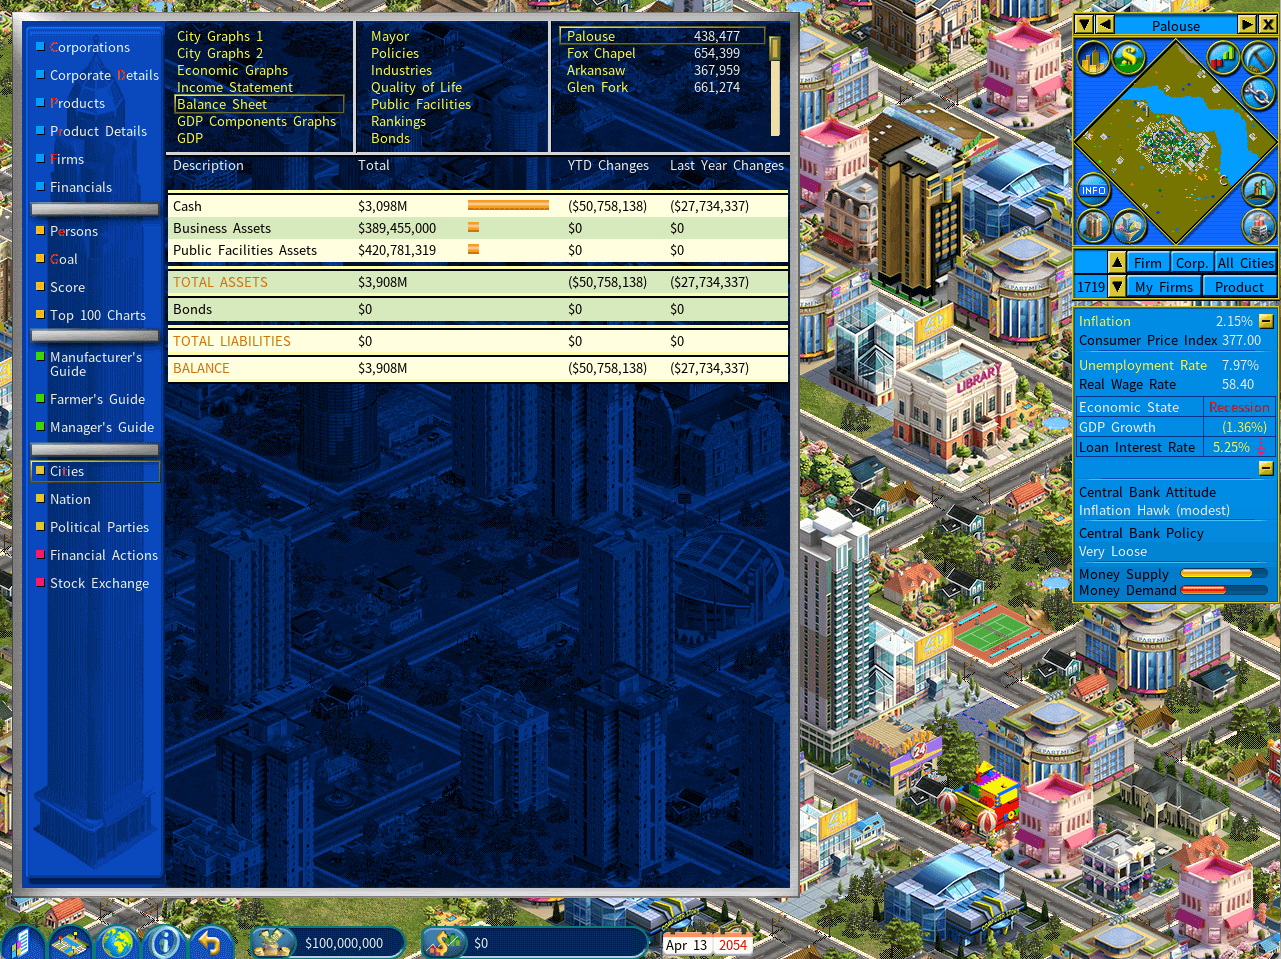
Balance Sheet
The balance sheet of the city government.
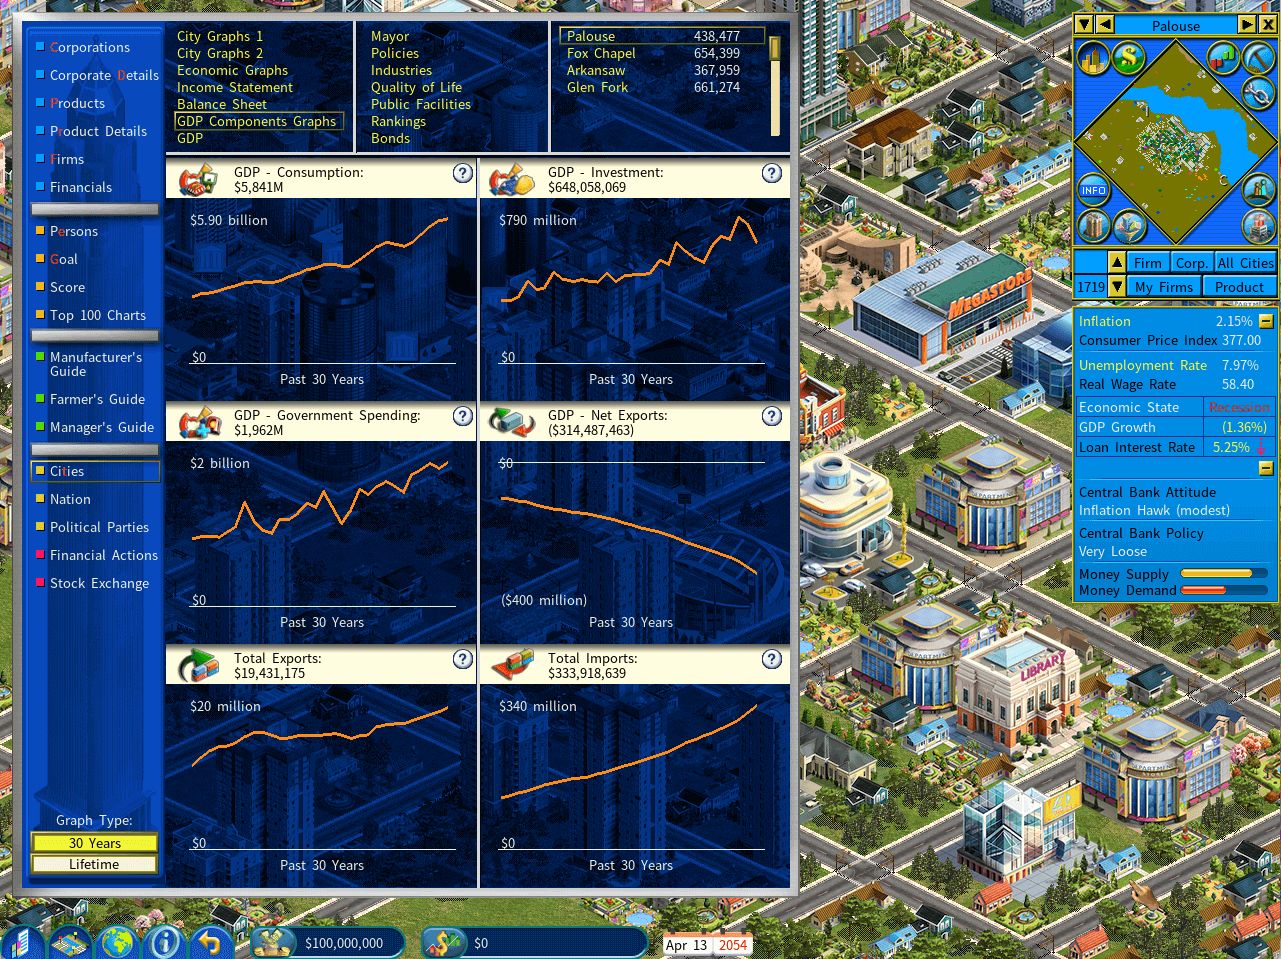
GDP Component Graphs
GDP is the sum of four components, each charted separately:
- Consumption — the value of goods and services bought by people.
- Investment — total investment by businesses.
- Government spending — total spending by the city government.
- Net exports — exports less imports.
GDP Details
The dollar amounts behind each component of GDP.
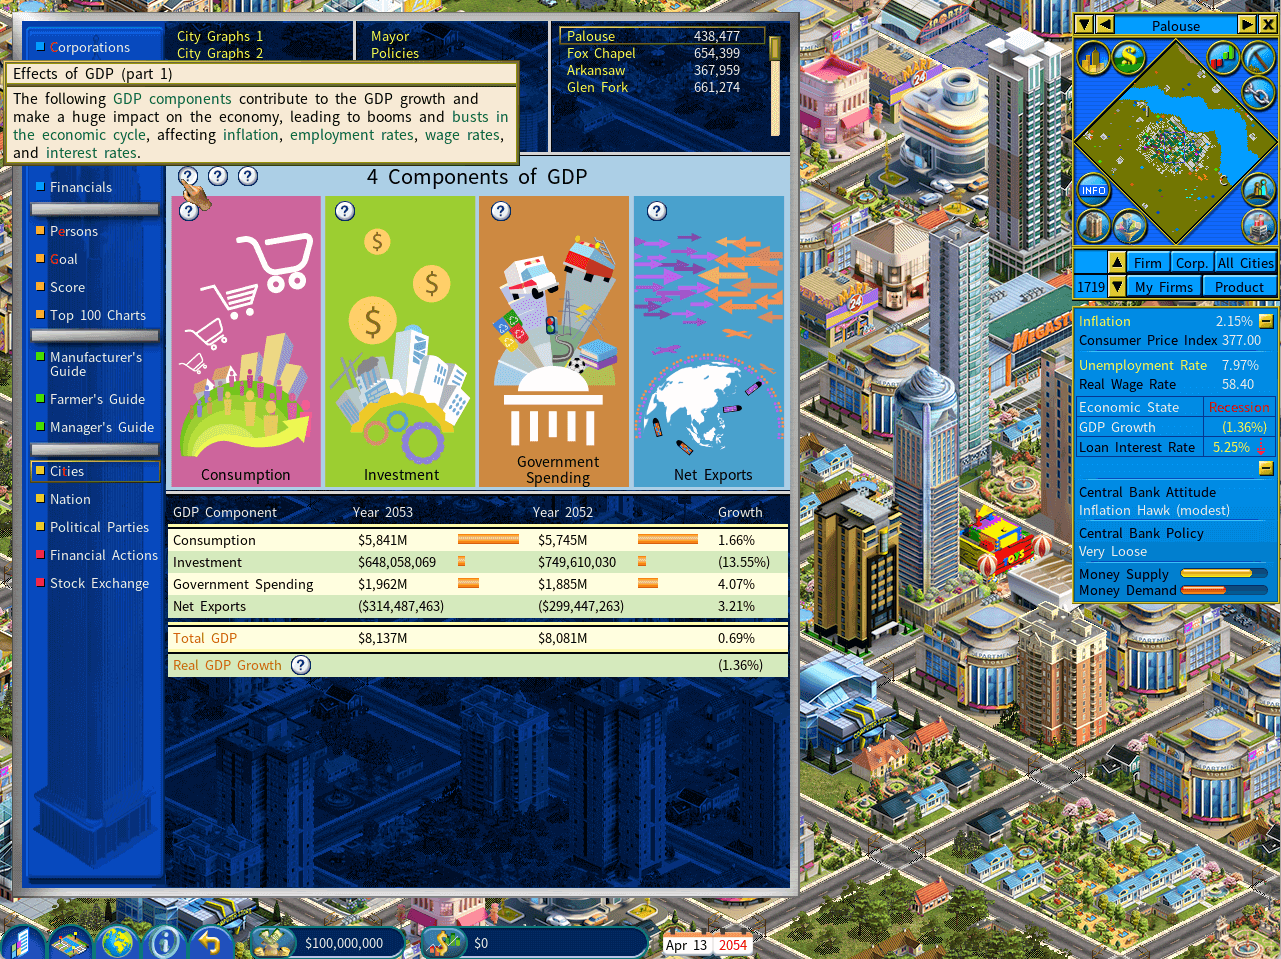
Mayor
The city’s mayoral history, past election results, and the status of the next election if one falls this year.
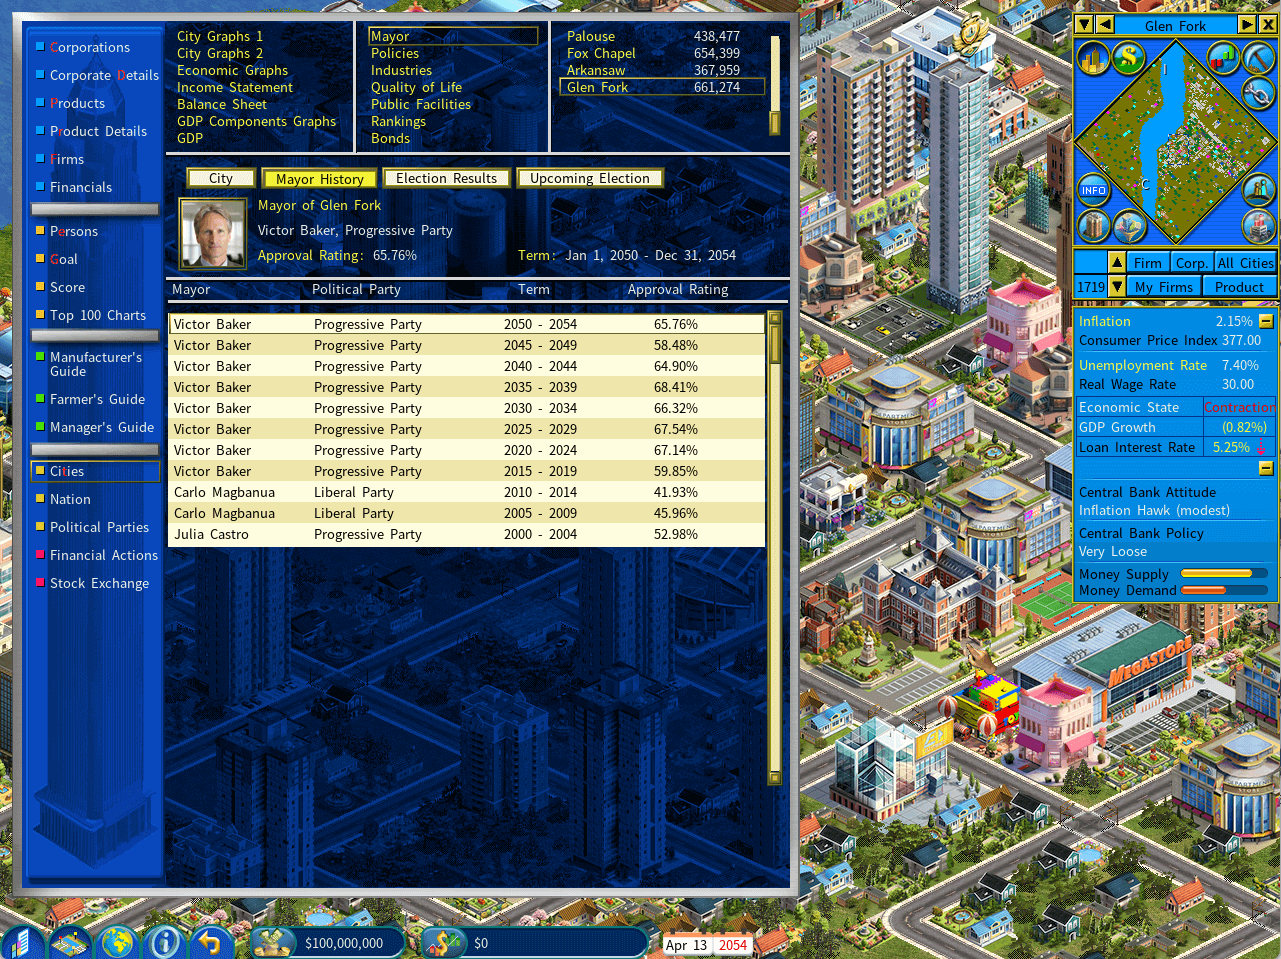
City Policies
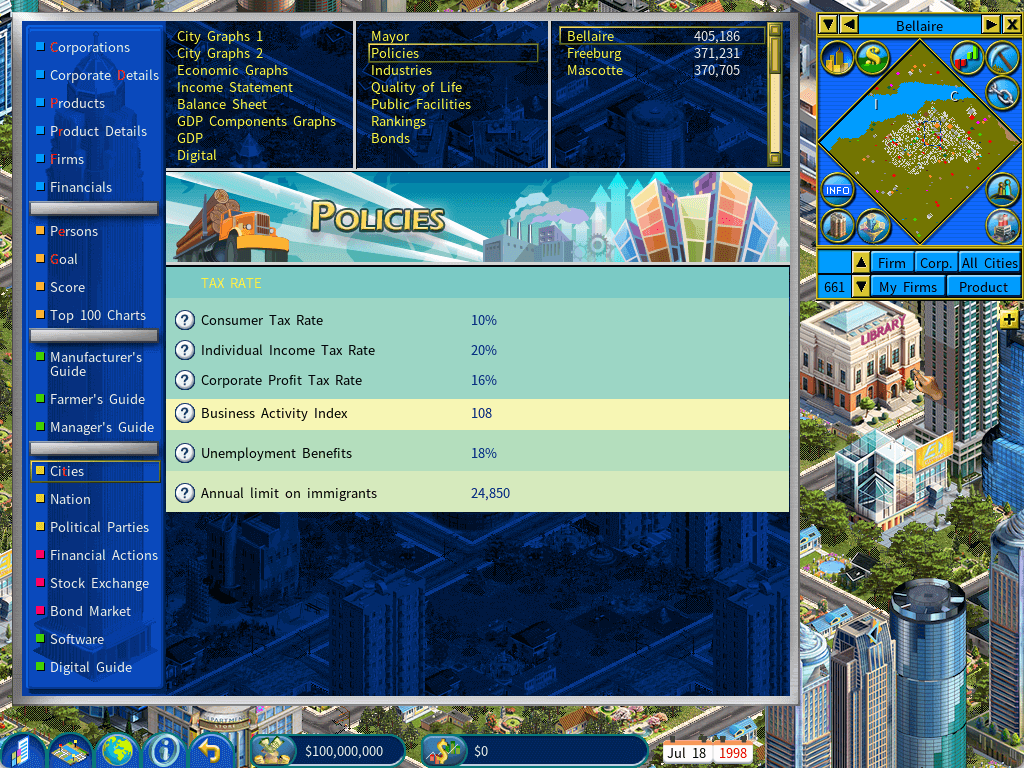
| Policy | What it does |
|---|---|
| Consumer tax rate | Charged whenever consumers spend: tax = product price × consumer tax rate. Set it too high and consumer spending declines, which in turn hurts the business sector. |
| Individual income tax rate | Too high a rate depresses consumer spending, and the Jobs and Income category of the Quality of Life index falls with it. |
| Corporate profit tax rate | A high rate brings the city greater tax revenue; a low rate attracts business investment. |
| Unemployment benefits pay rate | Benefits as a percentage of the reference salary. |
| Annual limit on immigrants | Cities tighten immigration when there are not enough jobs for newcomers, or when public facilities cannot keep up with the population. |
Industries
The city’s competitiveness across industries.
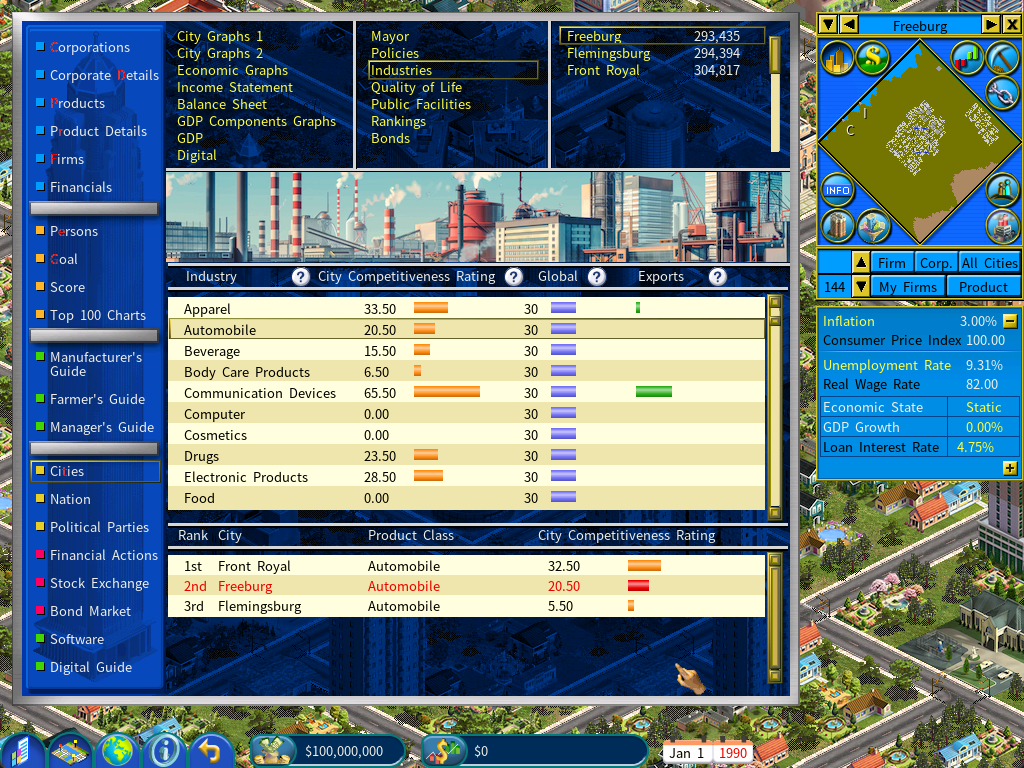
| Column | What it tells you |
|---|---|
| City competitiveness rating | The higher it is, the more people are employed in that local industry. A weak rating forces the city to import large volumes, which costs manufacturing jobs. |
| Global competitiveness rating | The benchmark. Once the city’s rating exceeds it, the city can export to the world market. |
| Volume of export | Exports begin only above the global rating, and strong exports improve city employment significantly. |
Quality of Life
Each element below carries a distinct weight, shown in the Weight column.
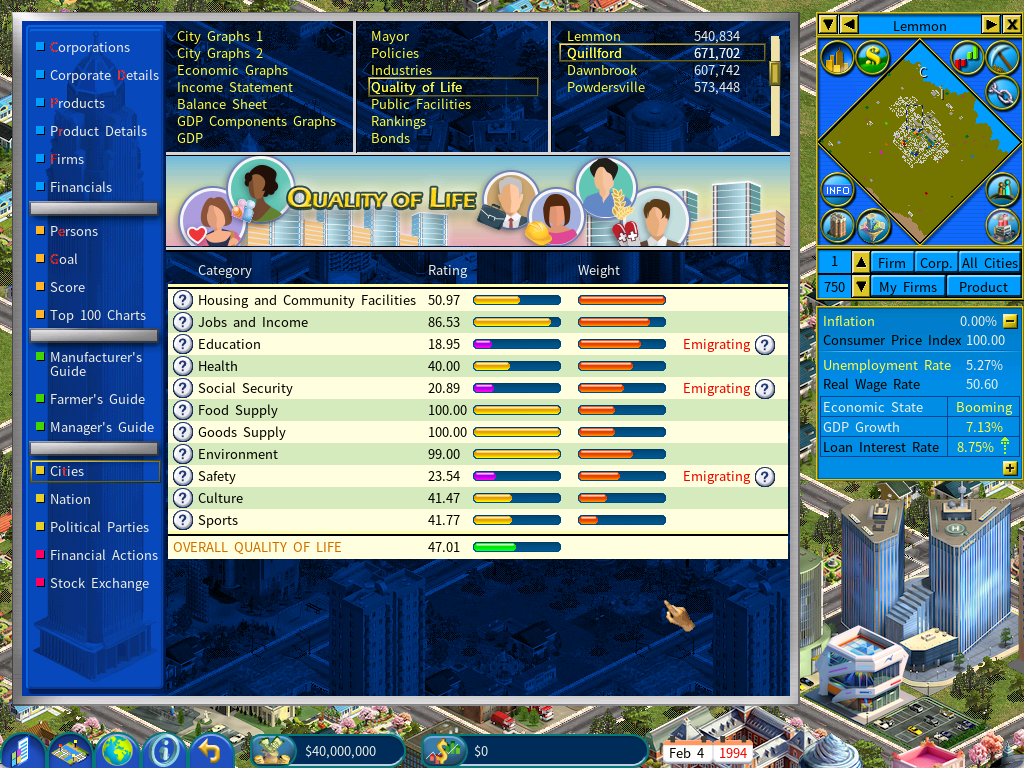
| Element | What determines the rating |
|---|---|
| Housing and community facilities | The city’s housing supply and the average Overall Rating of existing apartments. |
| Jobs and income | The wage level, the unemployment rate and the individual income tax rate. |
| Education | The Overall Satisfaction ratings of schools and universities (on the Public Facilities page) and the education levels of citizens (in a school’s or university’s detail window). |
| Health | The Overall Satisfaction ratings of the city’s hospitals. |
| Social security | The average unemployment benefits pay rate, as a percentage of the reference salary, over the past three years. |
| Safety | The Overall Satisfaction ratings of police stations and fire stations. |
| Food availability at retail | The variety and supply of food on sale. |
| Products availability at retail | The variety and supply of consumer products on sale. |
| Environment | The city’s pollution level — select Pollution mode on the minimap to see it. |
| Sports | The Overall Satisfaction ratings of the city’s sports facilities. |
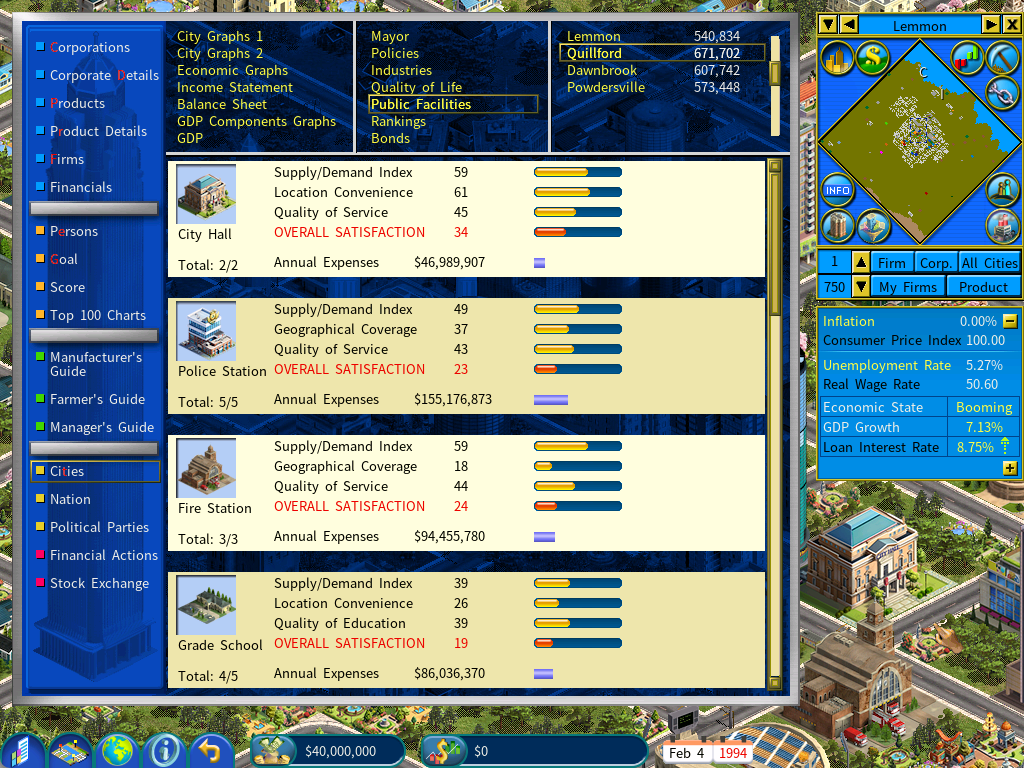
Public Facilities
Every public facility owned and operated by the city government.
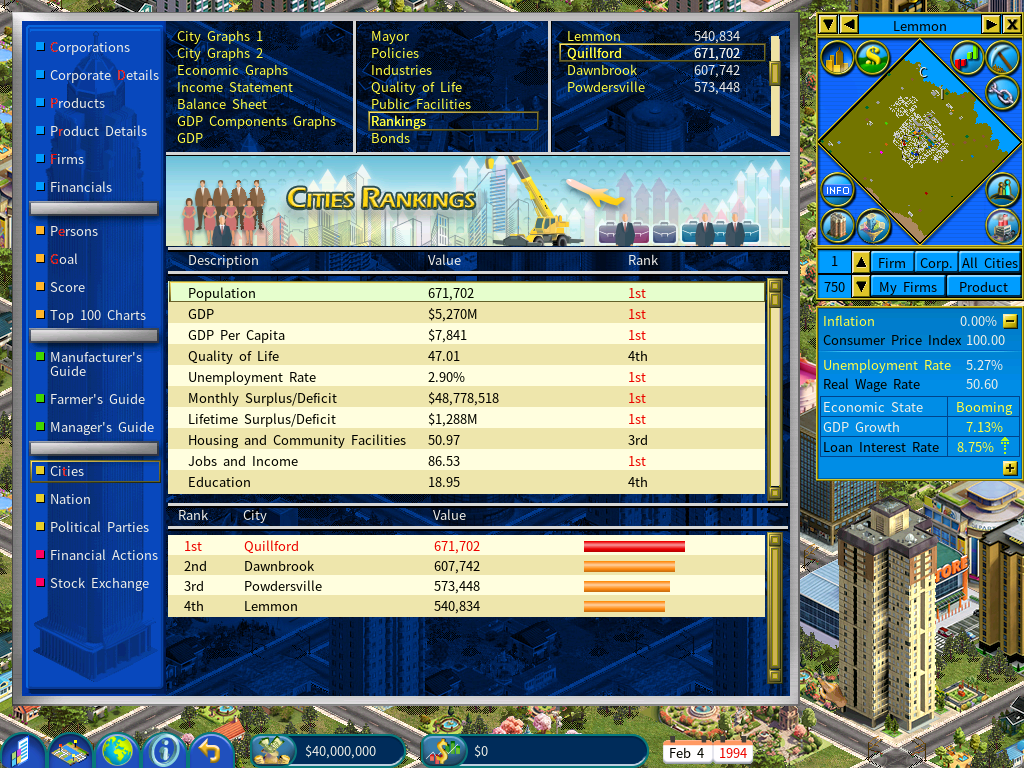
Rankings
How this city ranks against the others across various performance categories.
Bonds
The city government can raise financing by issuing bonds.