Ultra-realistic City Economic Simulation
This DLC introduces a groundbreaking city simulation model, delivering an unparalleled level of realism and depth to your urban planning endeavors. Here’s what awaits you:
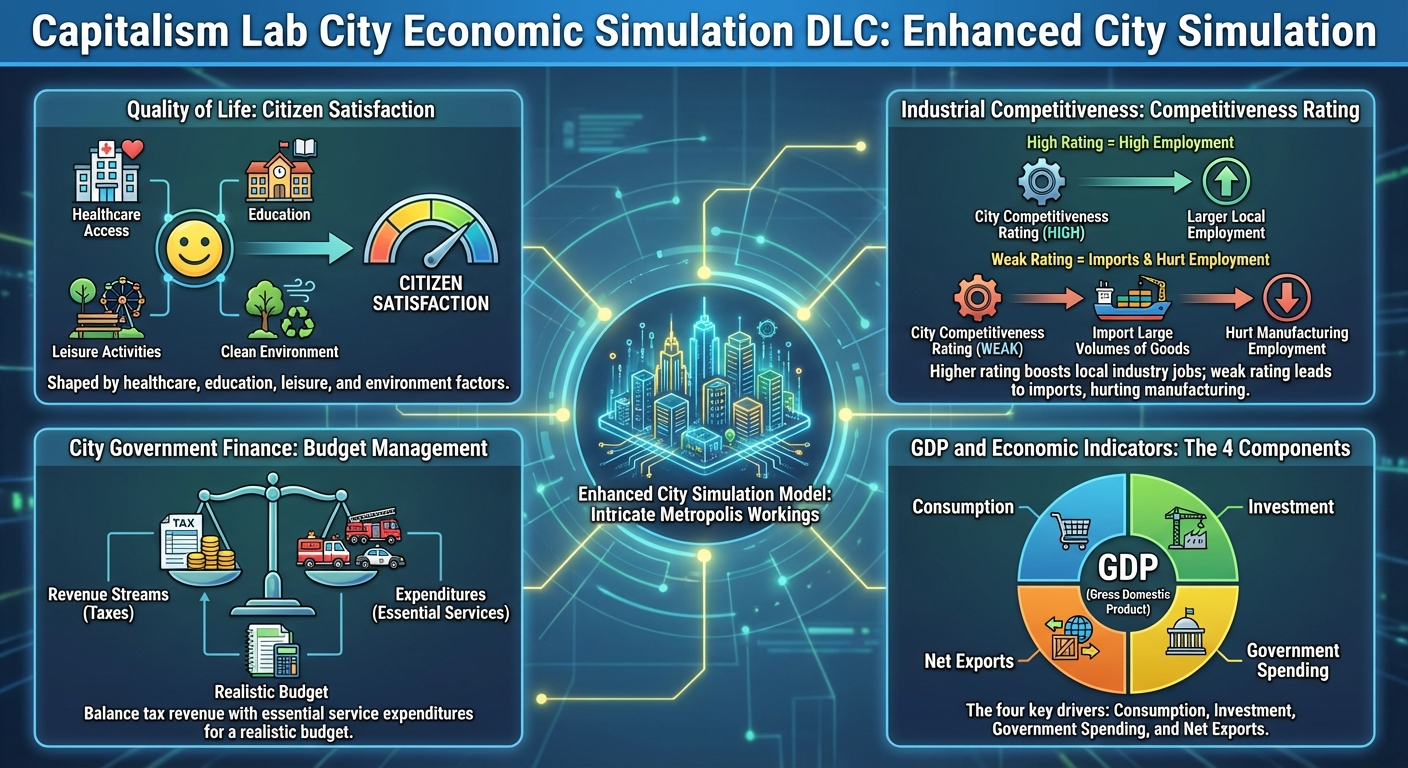
Enhanced City Simulation:
Prepare to delve into the intricate workings of a metropolis with the new simulation model. This sophisticated system encompasses a wide array of factors that influence a city’s growth and prosperity, including:
- Quality of Life: Witness how citizen satisfaction is shaped by factors like access to healthcare, education, leisure activities, and a clean environment.
- Industrial Competitiveness: Analyze and strategize your city’s strengths in specific industries on a global scale.
- City Government Finance: Manage a realistic budget, balancing revenue streams from taxes with expenditures on essential services.
- GDP and Economic Indicators: Track your city’s economic performance through detailed GDP breakdowns, revealing the contributions of different sectors and industries.
- Tax System: Implement and adjust tax policies, observing their impact on citizen satisfaction, business profitability, and overall economic activity.
Enhanced Simulation, Refined Scale:
To accommodate this sophisticated model and its intricate calculations, the DLC introduces a refined city size. While the population scale is approximately one-tenth of the base game, this allows for significantly deeper simulation of individual citizens and their behavior. Expect to manage cities of around 500,000, offering a more focused and engaging experience.
While the population scale has been adjusted, the core gameplay experience remains engaging and rewarding. The supply and demand dynamics across retail, manufacturing, farming, and natural resources have been meticulously recalibrated to ensure a balanced and challenging gameplay experience.
City Report
The City Report, accessible through the Information Center, provides a comprehensive overview of your urban landscape. This detailed document is organized into multiple sections, each offering valuable insights into different aspects of your city’s performance and dynamics. The following segments will delve into these sections, explaining the wealth of information at your disposal.
City Graphs 1
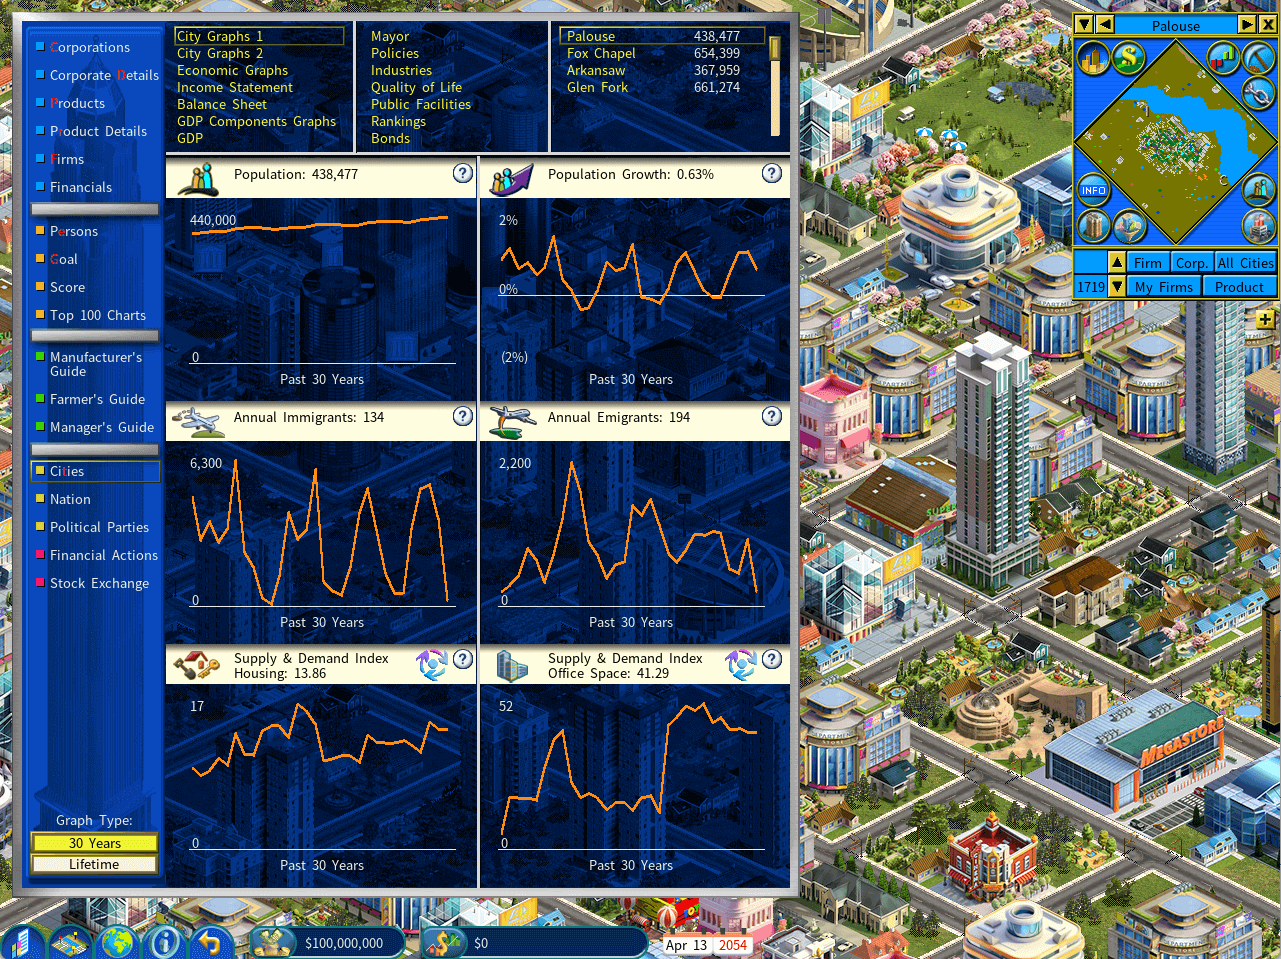
This shows the city’s population changes over time.
City Population Growth
A city’s population growth is supported by a low employment rate, high quality of living, and sufficient supplies of new apartments.
Annual Immigrants
The number of immigrants to the city annually.
Annual Emigrants
The number of people emigrated from the city annually.
Housing Supply and Demand Index
A positive value means that the housing supply is greater than the housing demand, and vice versa.
Office Space Supply and Demand Index
A positive value means that the office space supply is greater than the office space demand, and vice versa.
City Graphs 2
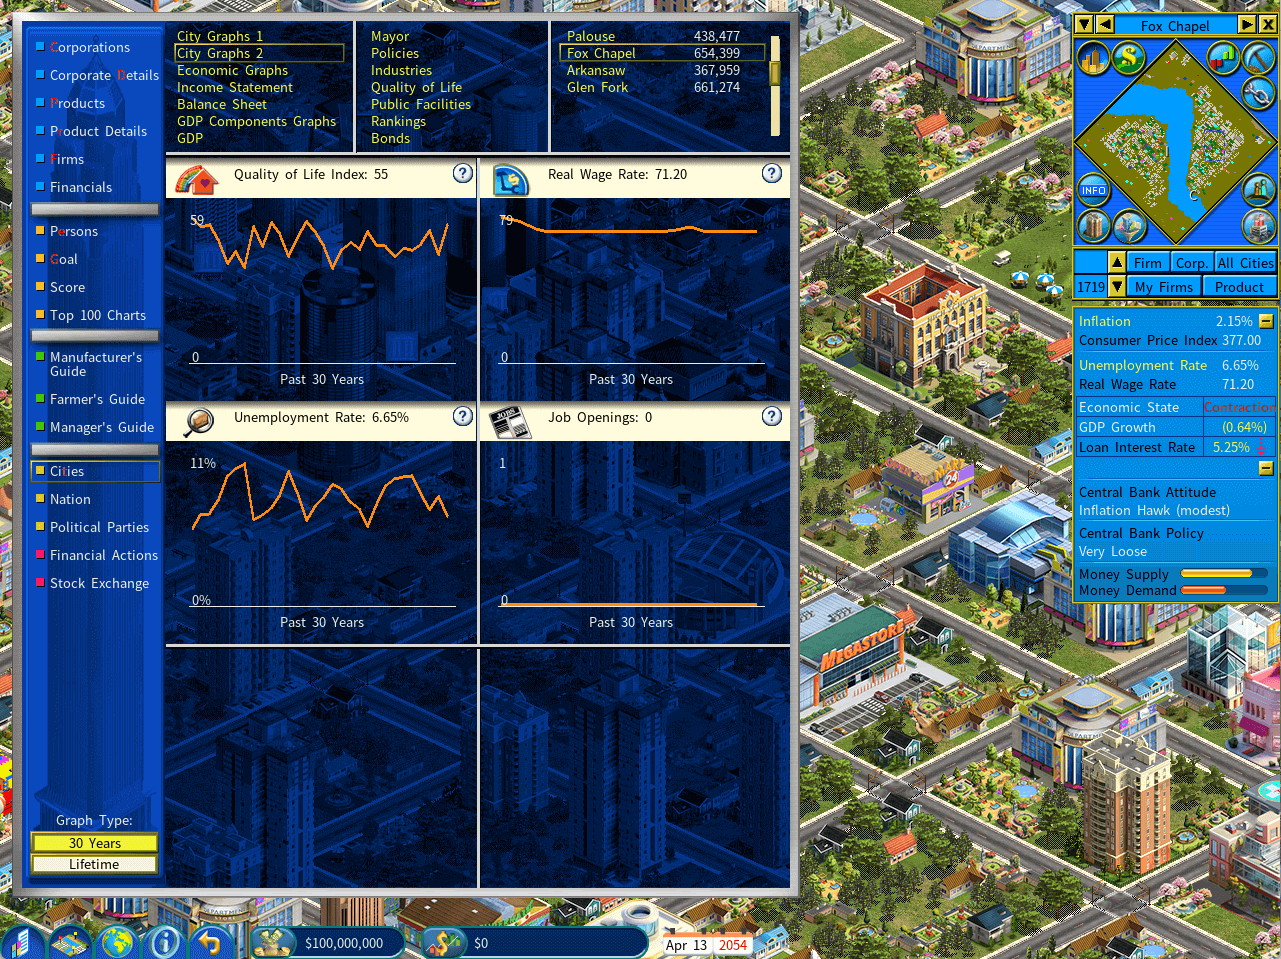
People enjoy their lives better when they live in apartments with good access to community and sports facilities, a green environment and good shopping convenience, as well as a higher real wage rate.
The unemployment rate trends lower when the GDP growth is healthy and private companies are expanding and creating new jobs.
Generally, when there is a large number of job openings available in the city, the city can afford to accept immigrants at a faster pace.
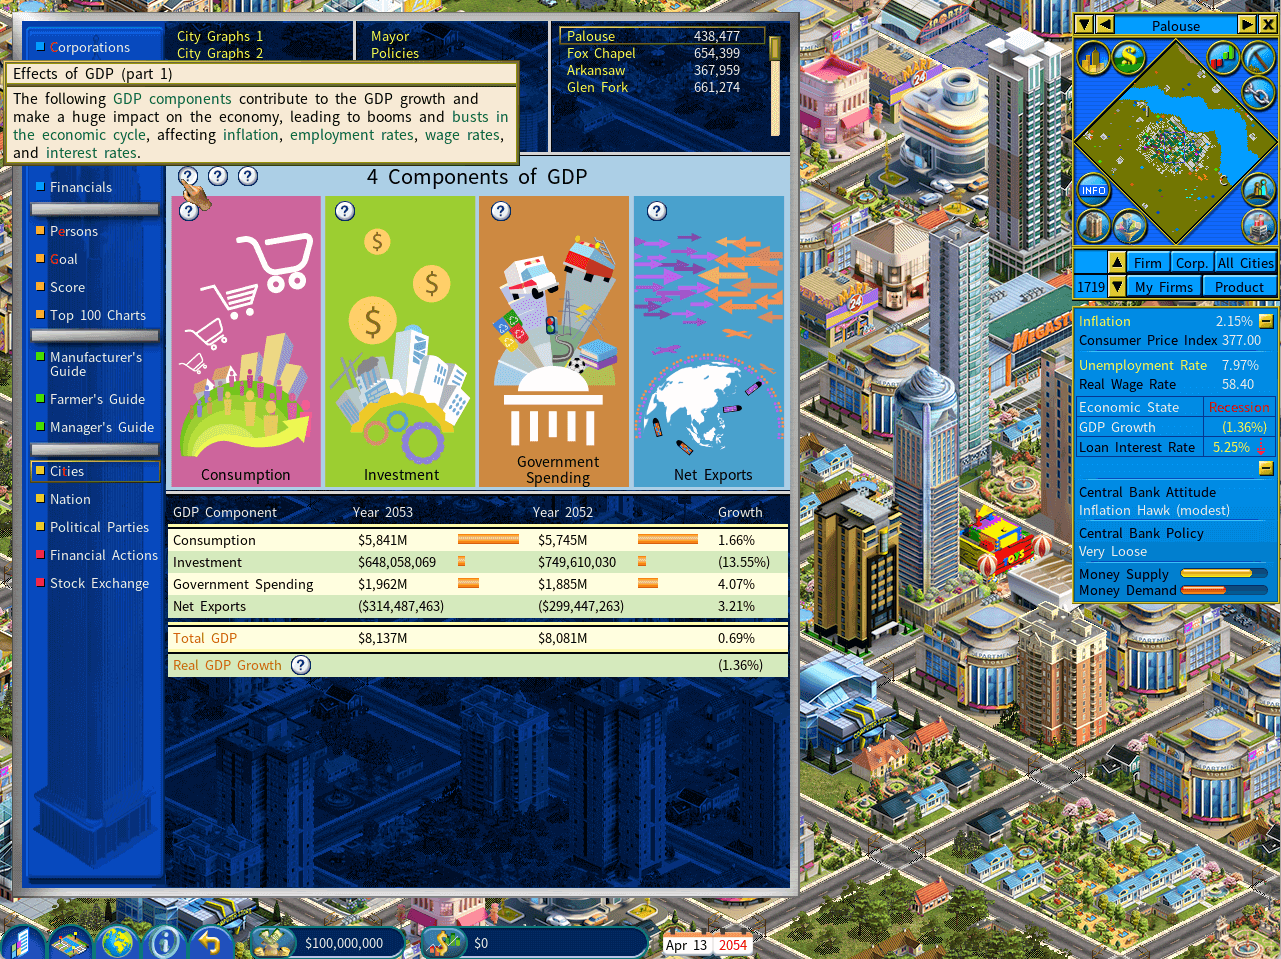
Economic Graphs
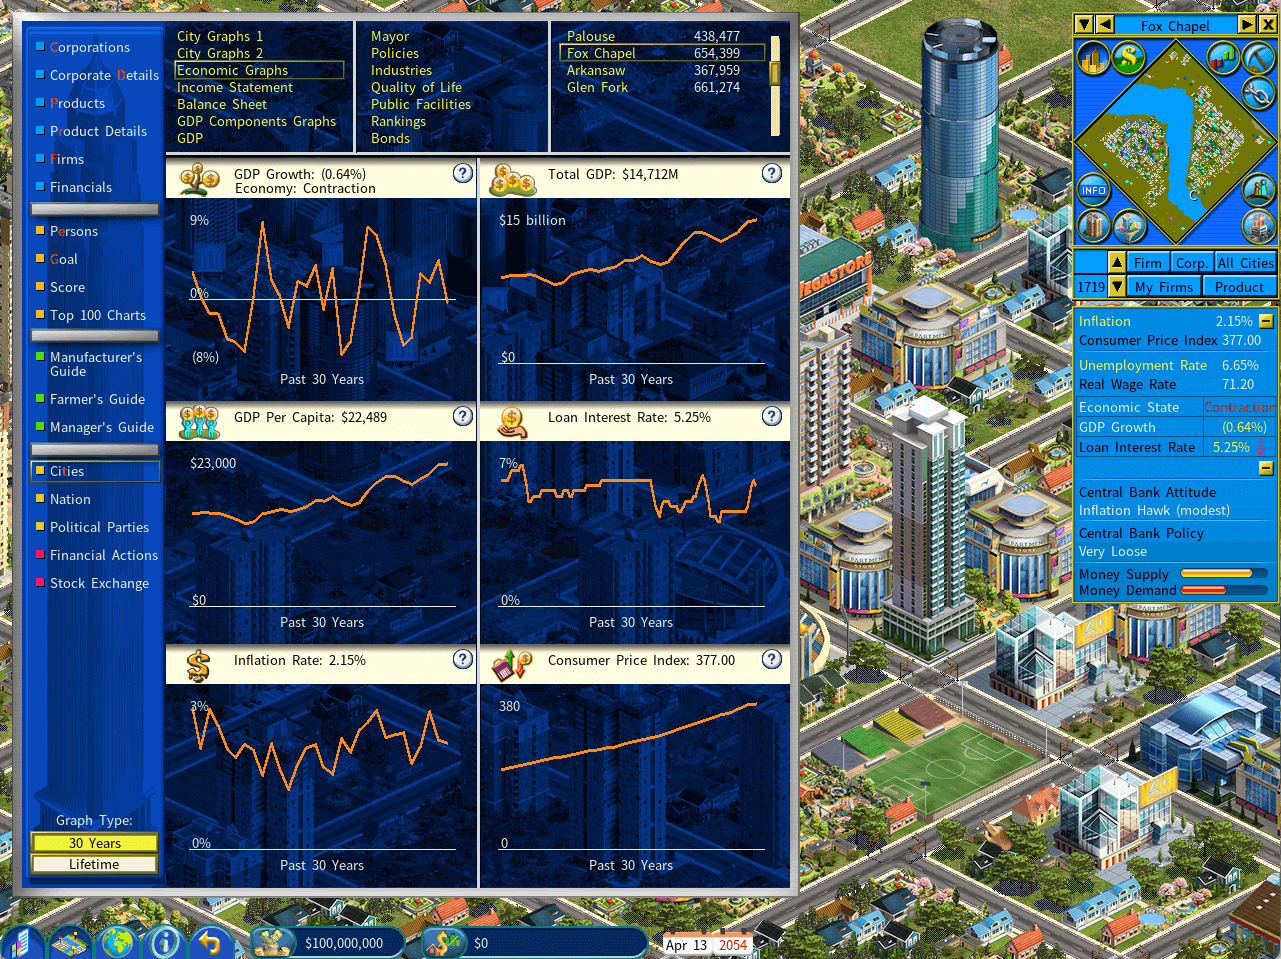
GDP growth is affected by consumer spending, private investment, government spending and net exports.
The total GDP is the sum of the consumption, private investment, government spending and net exports.
This value indicates the approximate value of goods produced per person in the city. It equals to the total GDP divided by the total number of people in the city.
A growing wage rate means that people are earning more money.
The inflation rate is affected by the unemployment rate (people spend less when they are unemployed) and the money demand and supply (higher money supply promotes spending).
Purchasing power is the amount of goods or services that one can buy with a unit of currency. Inflation erodes purchasing power.
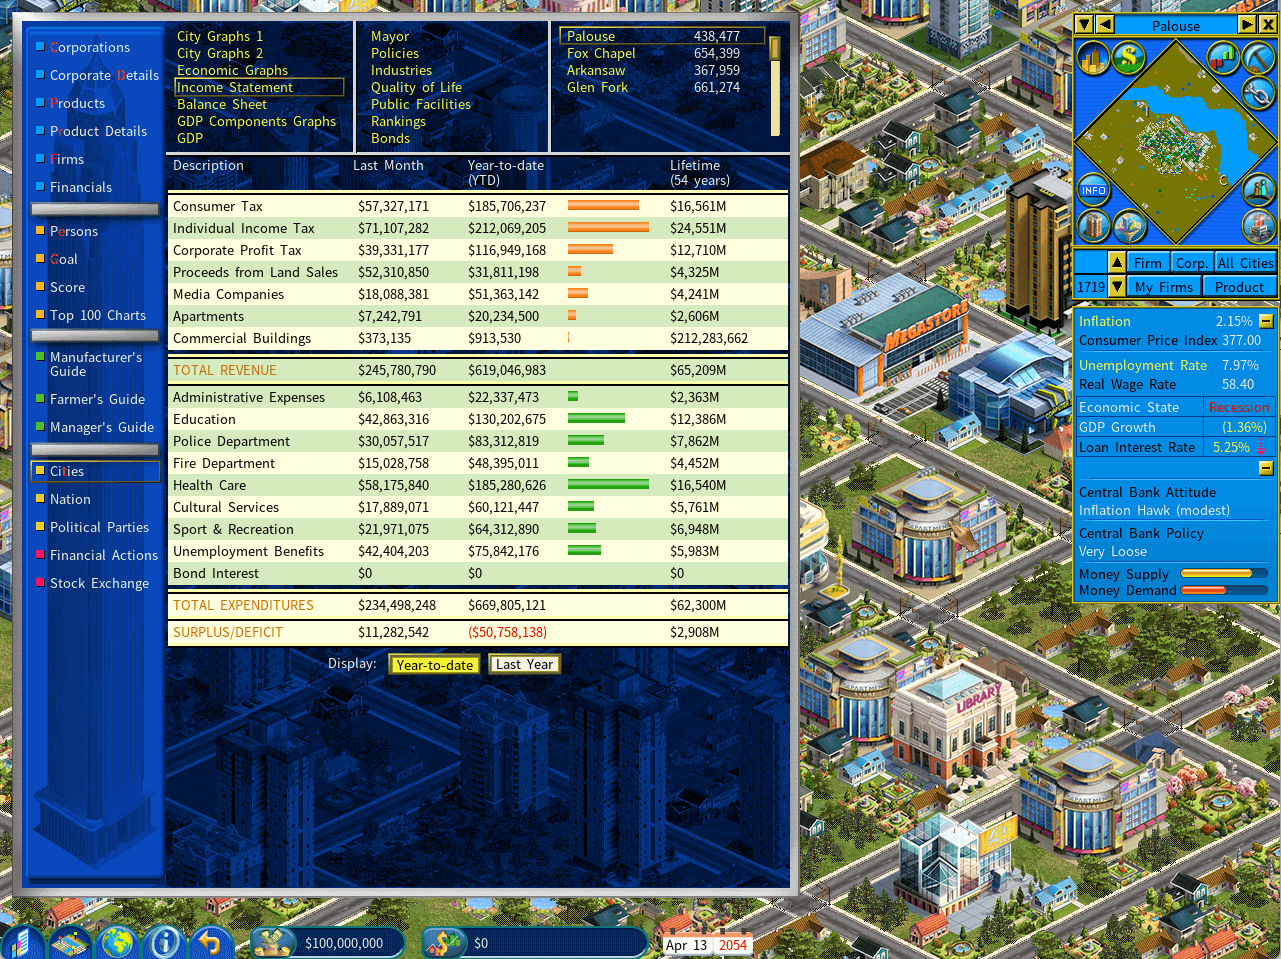
Income Statement
It shows the income statement of the city government.
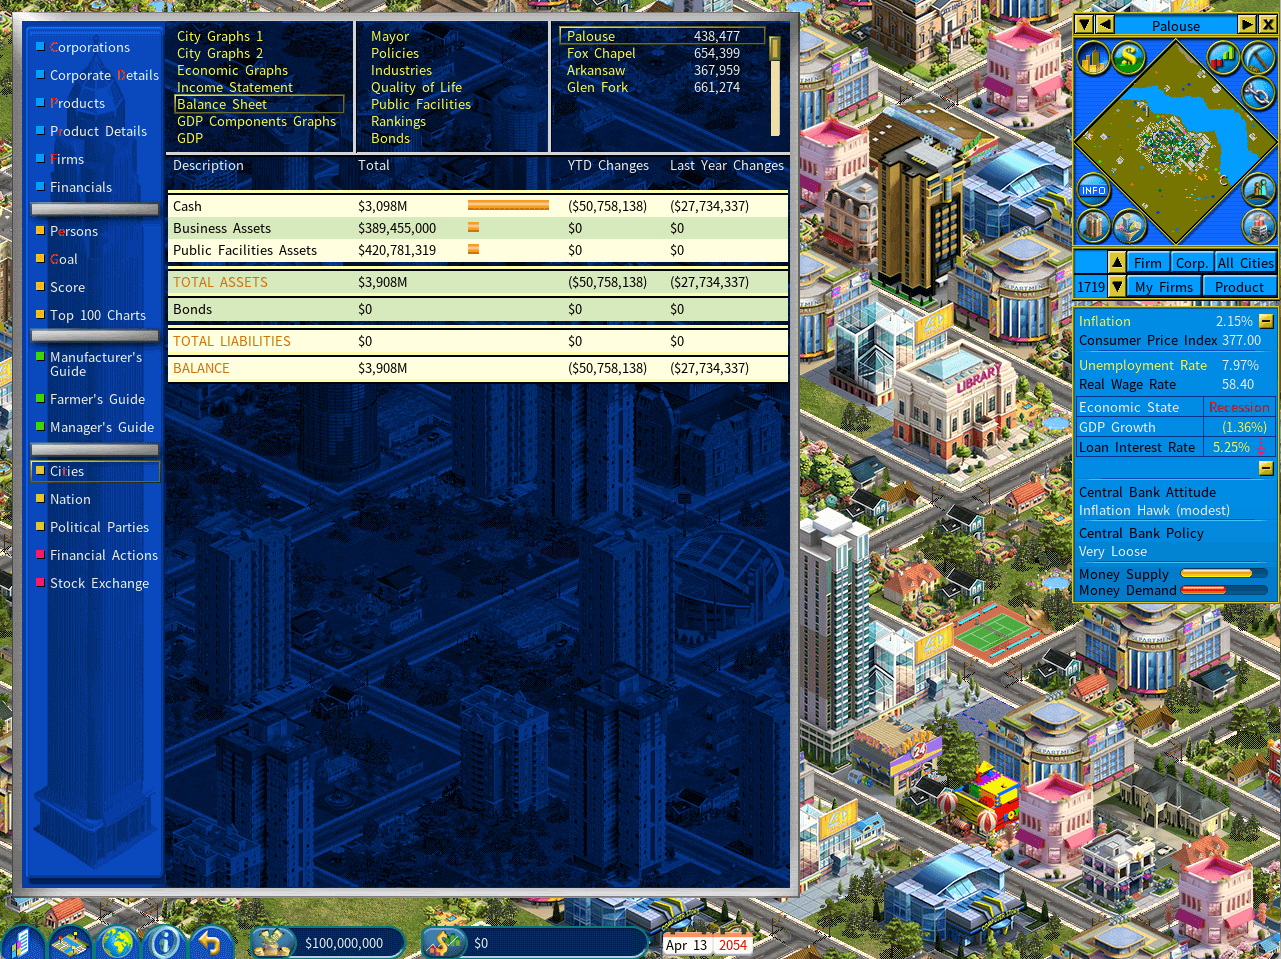
Balance Sheet
It shows the balance sheet of the city government.
GDP Components Graphs
GDP is the sum of consumption, investment, government spending and net exports.
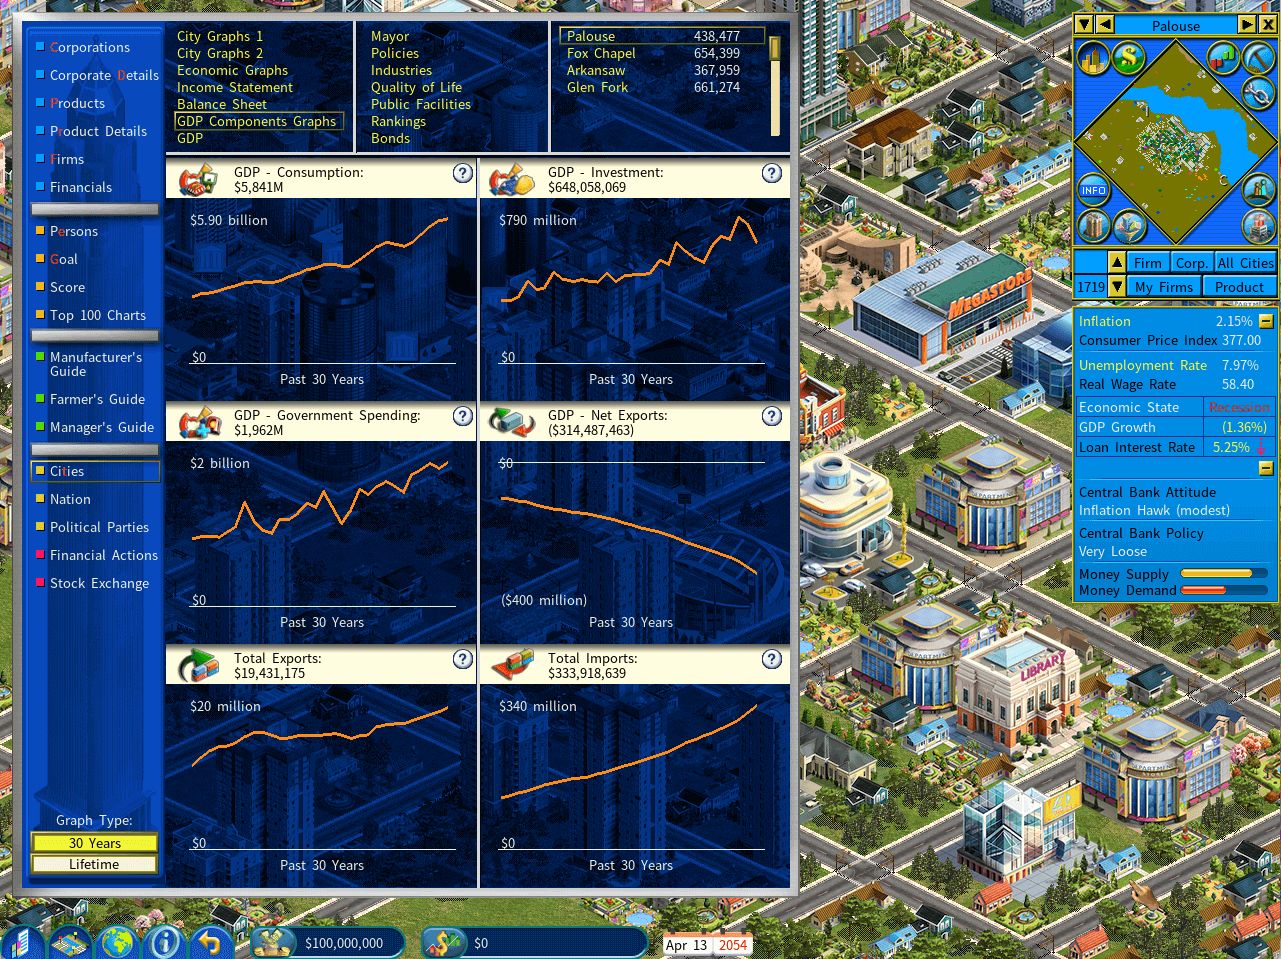
GDP Details
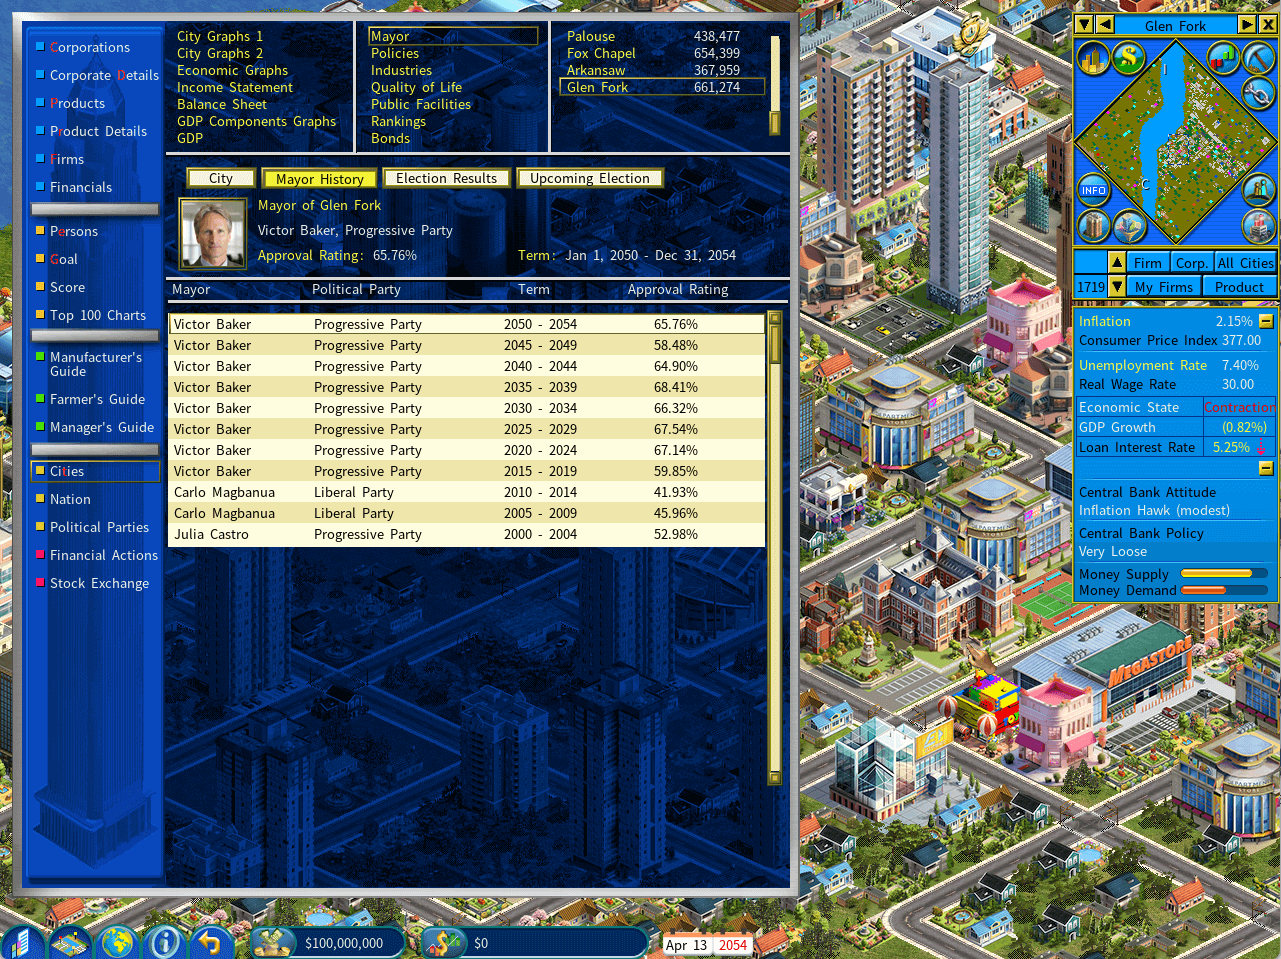
Mayor
On this screen, you can explore the city’s mayoral history, review past election results, and check the status of the upcoming election, if one is scheduled for this year.
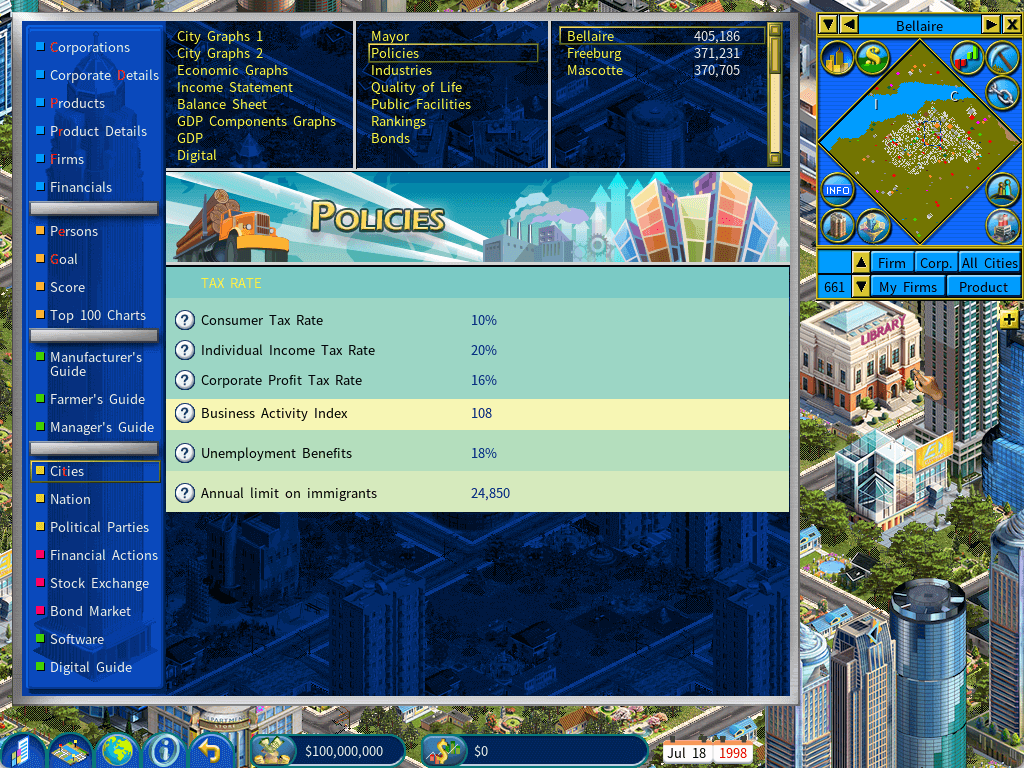
City Policies
Consumer Tax Rate
Consumer taxes are charged whenever consumers spending money on goods. (Tax = Product Price X Consumer Tax Rate). When a city’s consumer tax rate is too high, consumer spending will decline. Weak consumer spending will in turn adversely affect the business sector.
When a city’s individual income tax rate is too high, it will have a negative effect on consumer spending. In addition, the “Jobs and Income” category of the Quality of Life index will suffer a drop as well.
A high corporate profit tax rate brings in greater tax revenue for the city whereas a low corporate profit tax attracts business investment.
The pay rate of unemployment benefits as a percentage of the reference salary.
When a city does not have sufficient job opportunities for new immigrants, or its public facilities cannot keep up with the demand by its growing population, the city is likely to tighten its immigration policy.
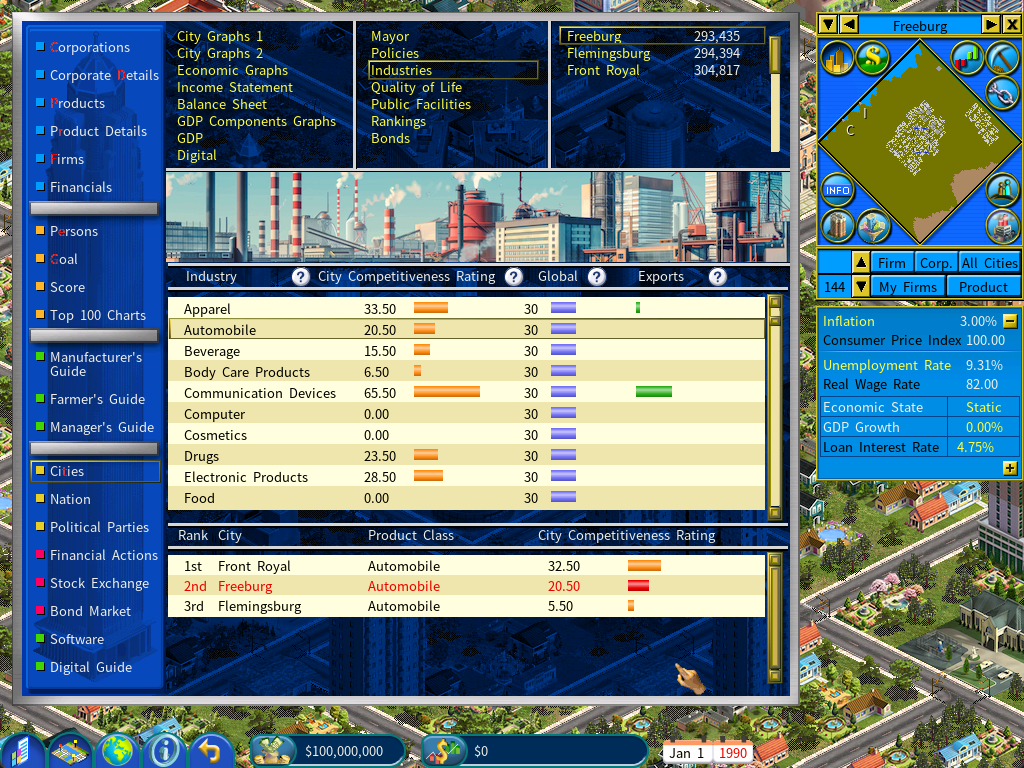
Industries
This report shows the city’s competitiveness across various industries. The list has the following columns:
The higher the city’s competitiveness rating, the larger number of people are employed in the local industry. When the city’s competitiveness is weak, it will have to import large volumes of goods, hurting employment in the manufacturing sector.
When the city’s competitiveness rating exceeds the global competitiveness rating, the city will be in a position to export its products to the worldwide market.
There will be export when the city’s competitiveness rating exceeds the global competitiveness rating. Strong export will improve the city’s employment significantly.
A city’s competitiveness can be increased by the following means:
1) A city’s competitiveness increases faster when there is a larger number of companies engaging in R&D or production activities in the industry in the city.
The types of business units that increase a city’s competitiveness include:
R&D units – the percentage of people in the city with university degrees will have an impact on the increase rate.
Manufacturing units and Farm Livestock Processing units – the percentage of people in the city with high school degrees will have an impact on the increase rate.
2) The city government may sponsor a university to conduct research to boost the city’s competitiveness in a specific industry.
Quality of Life
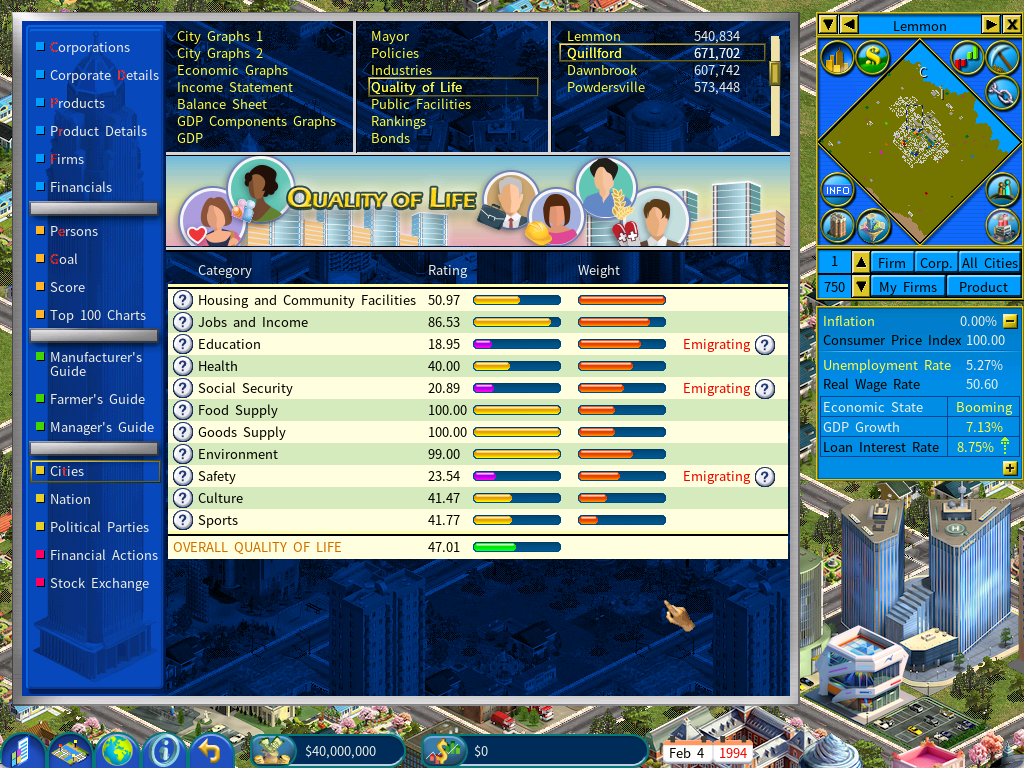
This rating is determined by the city’s Housing Supply and the average Overall Ratings of existing apartments.
This rating is determined by the city’s Wage Level, the Unemployment Rate, and the Individual Income Tax Rate.
This rating is determined by the Overall Satisfaction ratings of Schools and Universities in the city (details can be viewed on the “Public Facilities” page) and the Education Levels of the citizens (info can be viewed on the detail window of a school or a university.)
This rating is determined by the Overall Satisfaction ratings of Hospitals in the city (details can be viewed on the “Public Facilities” page).
This rating is determined by the average pay rate of Unemployment Benefits as a percentage of the reference salary in the past 3 years.
This rating is determined by the Overall Satisfaction ratings of Police Stations and Fire Stations in the city (details can be viewed on the “Public Facilities” page).
The variety and supply of food available at retail.
The variety and supply of consumer products available at retail.
Environment
This rating is determined by the Pollution level of the city. (Select Pollution mode on the mini map to see the city’s population level.)
Sports
This rating is determined by the Overall Satisfaction ratings of Sports Facilities in the city (details can be viewed on the “Public Facilities” page).
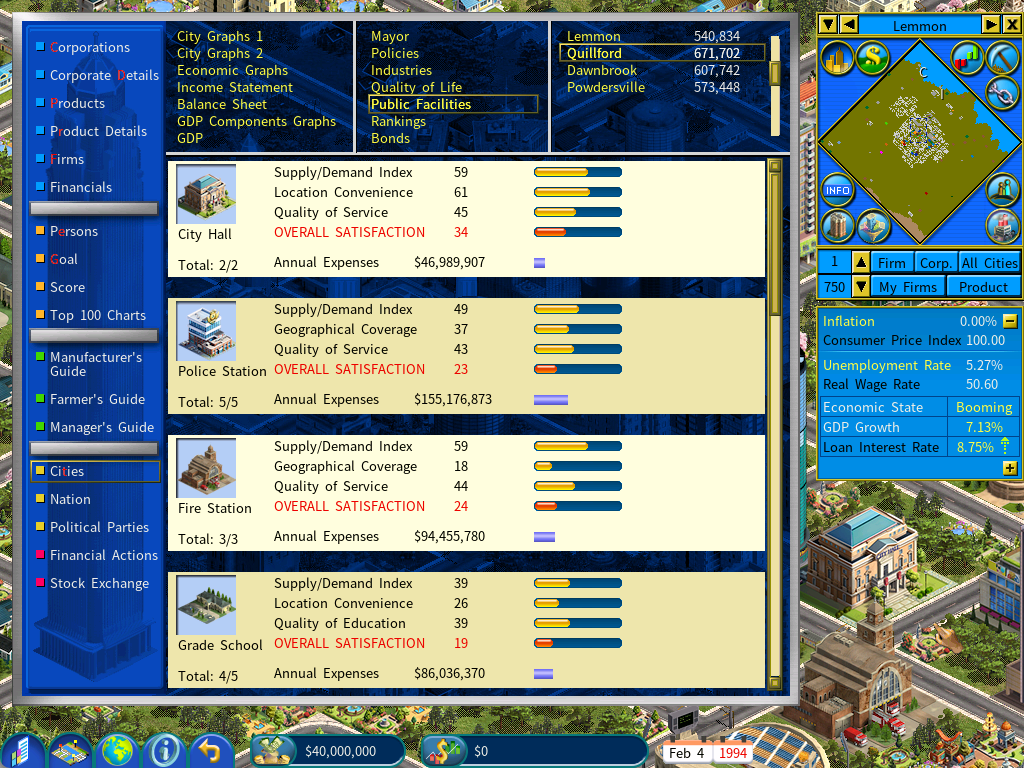
Public Facilities
This report provides a comprehensive list of the public facilities owned and operated by the city government.
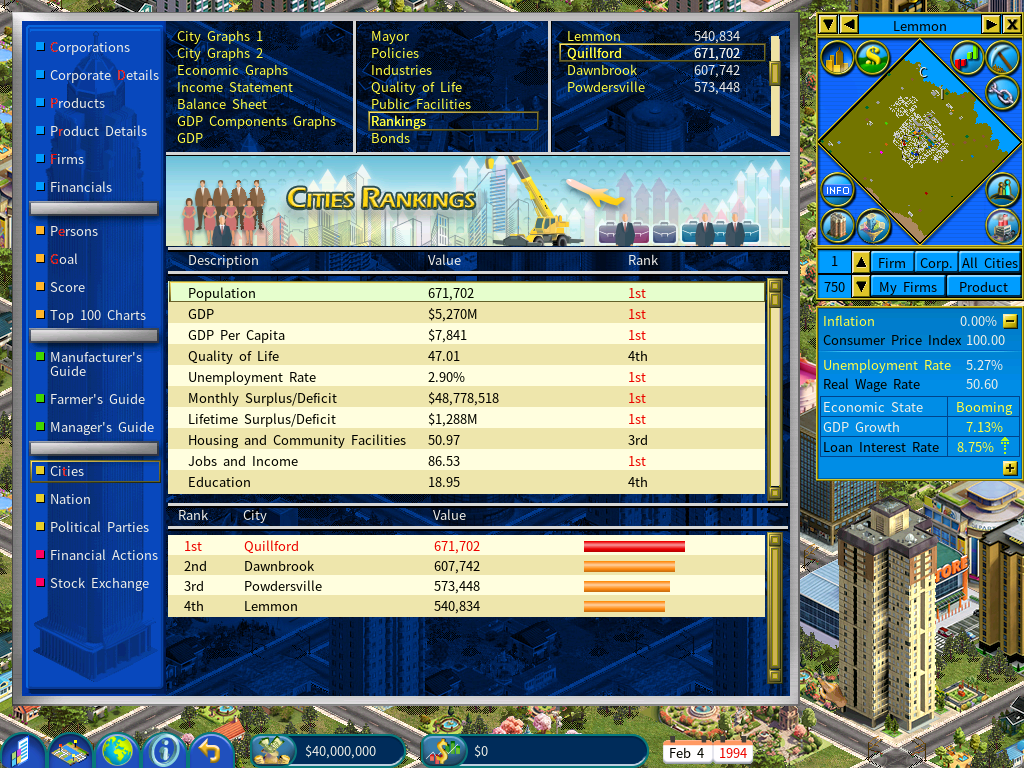
Rankings
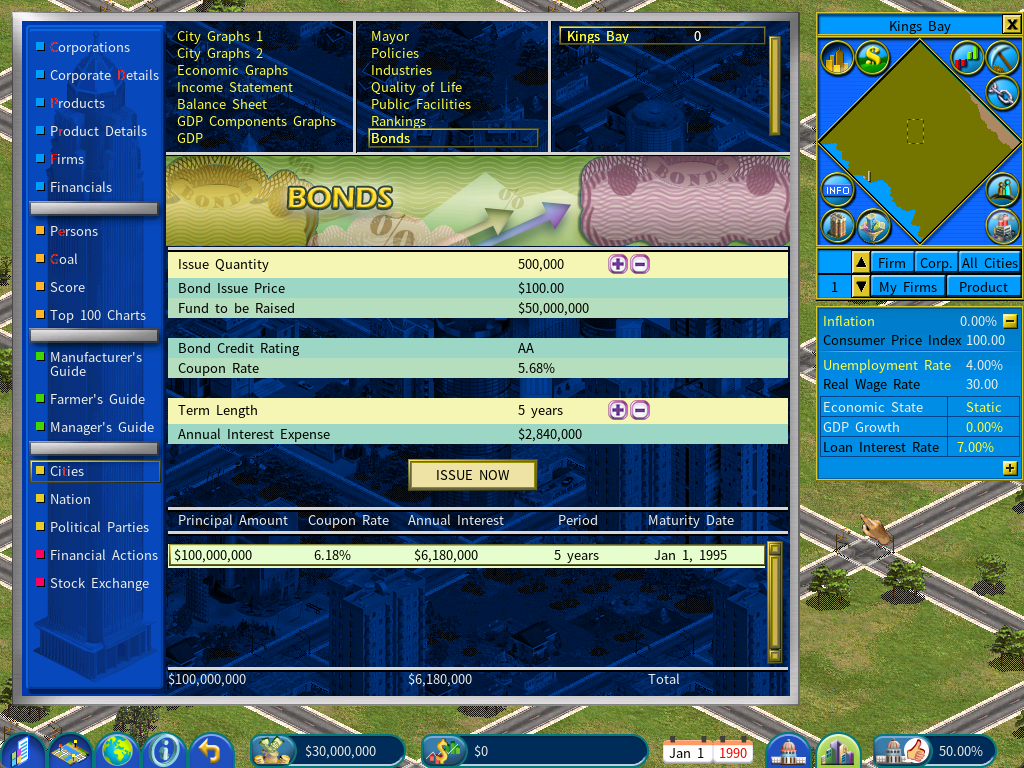
Bonds
The city government can secure financing through bond issuance.