New Minimap Modes
In the City Economic Simulation DLC, you will find two new buttons at the lower-right corner of the minimap.
Population and Pollution Mode
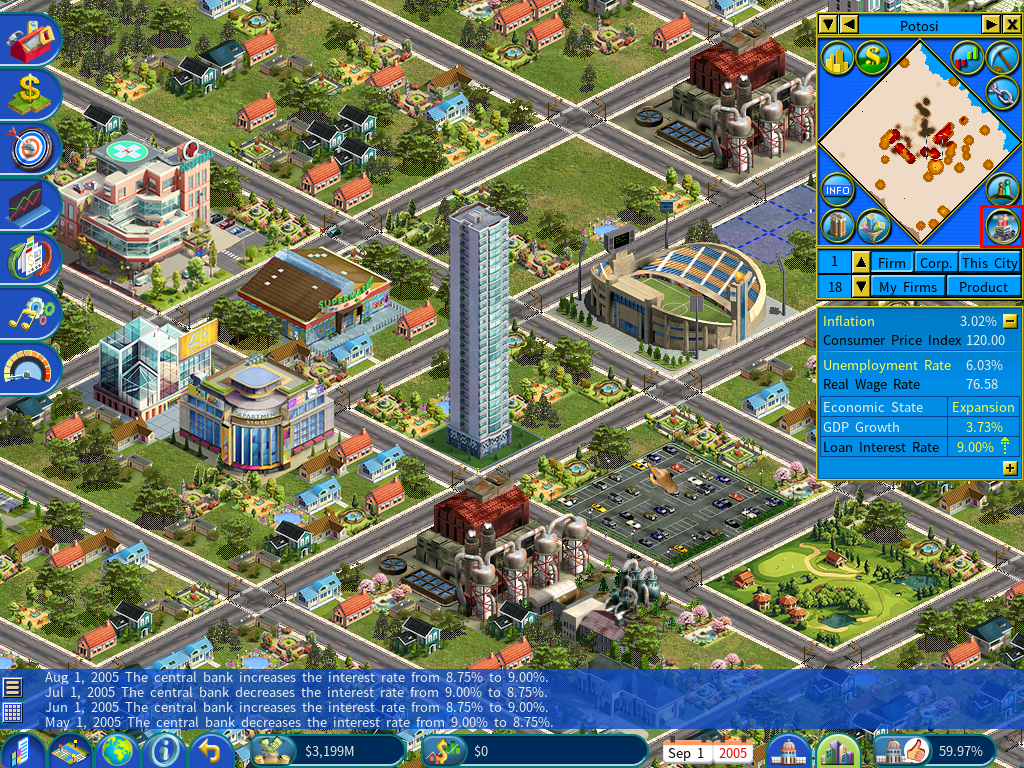
Click on the button as indicated on the above screenshot to switch the minimap to the population and pollution mode.
In this mode, population density is shown in dark brown colors.
Pollution is shown in orange and red colors:
- Red indicates pollution in populated areas
- Orange indicates pollution in unpopulated or very sparsely populated areas.
Population and Public Services Mode
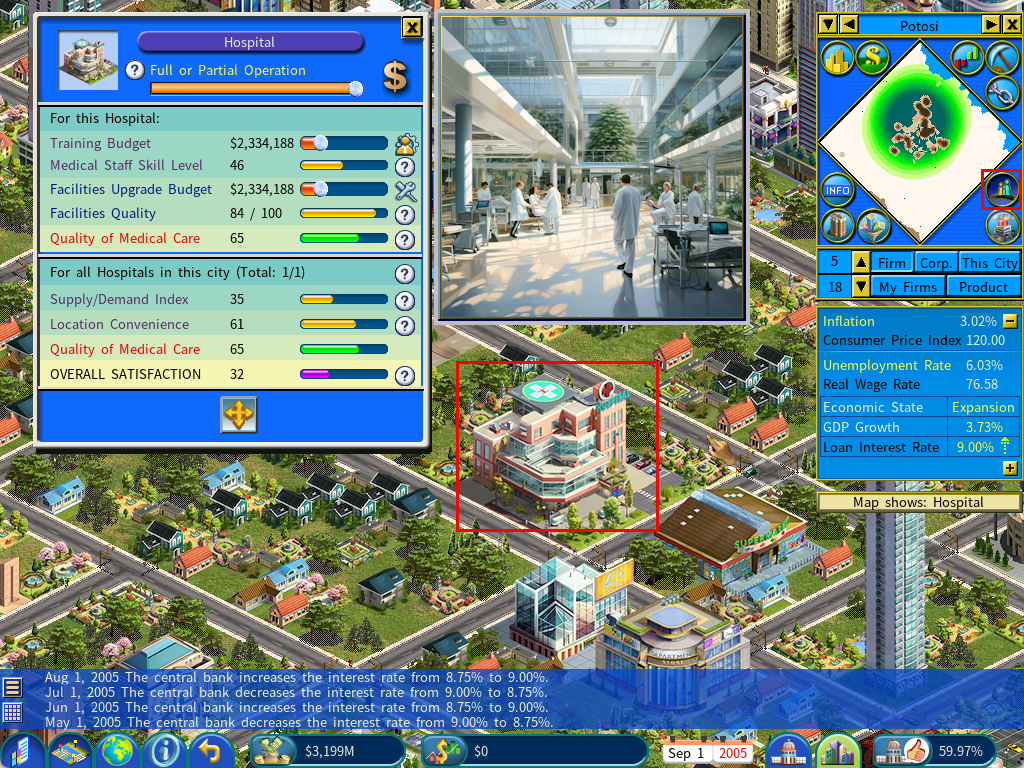
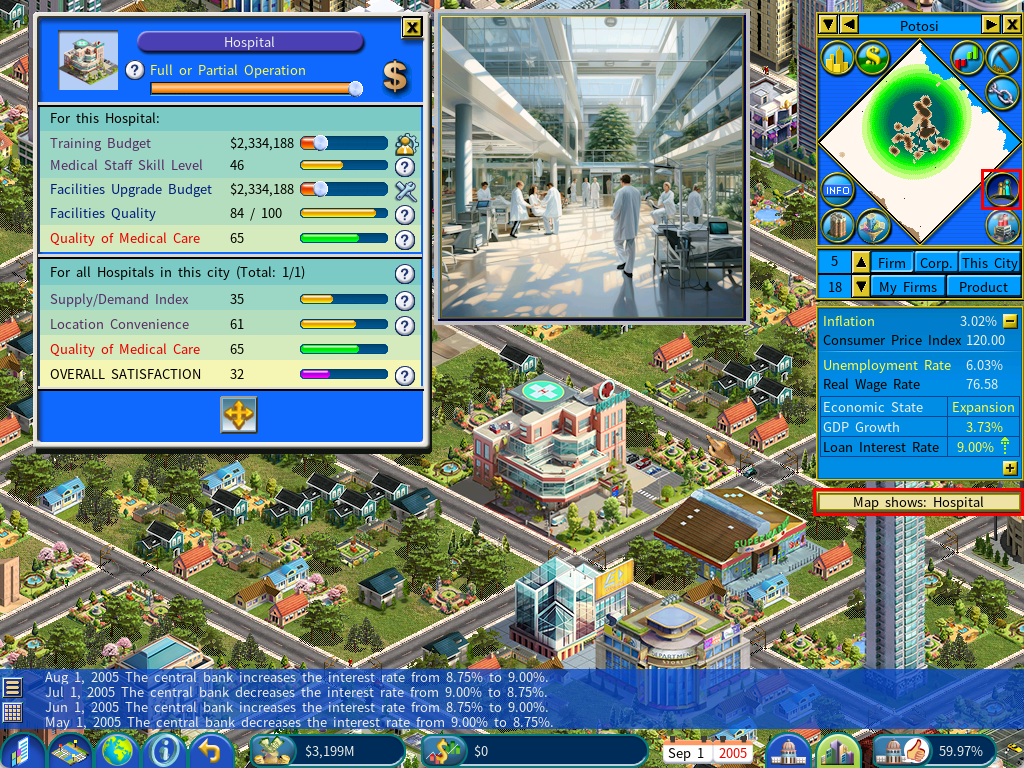
Click the button shown in the screenshot below to switch the minimap to Population and Public Services mode.
In this mode, population density is displayed using dark brown colors.
You can select a civic building or sports facility to evaluate how easily citizens can access the public services provided.
For instance, in the above screenshot, a hospital is selected, and the minimap highlights the areas of the city where residents can conveniently access its services.
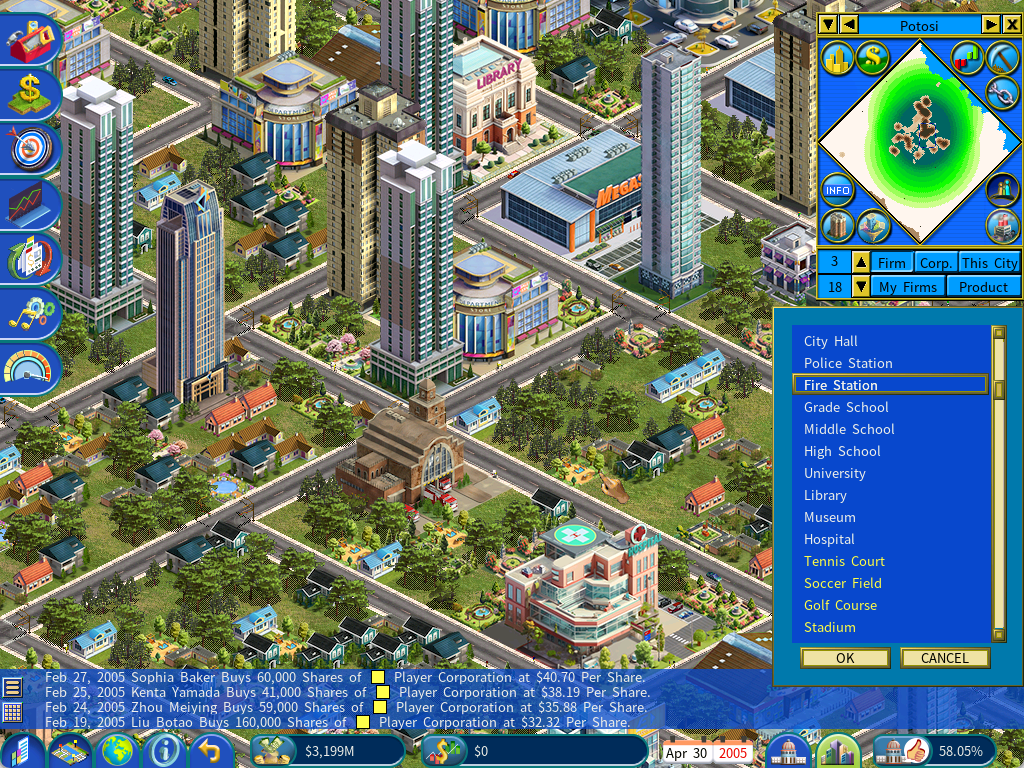
To view the geographic coverage of a different civic building, simply click on another civic building on the map or use the civic building selector shown in the screenshot below. The selector will display a list of civic buildings, allowing you to choose one easily.
To view the geographic coverage of a different civic building, simply click on another civic building on the map or use the civic building selector shown in the screenshot below. The selector will display a list of civic buildings, allowing you to choose one easily.
Central Business District (CBD)
The distance to the Central Business District (CBD) is one of the key factors that influence the overall rating of a commercial building.
To locate the CBD, you can switch the minimap to Land Value mode. The red dot on the minimap represents the CBD, as shown in the screenshot below.
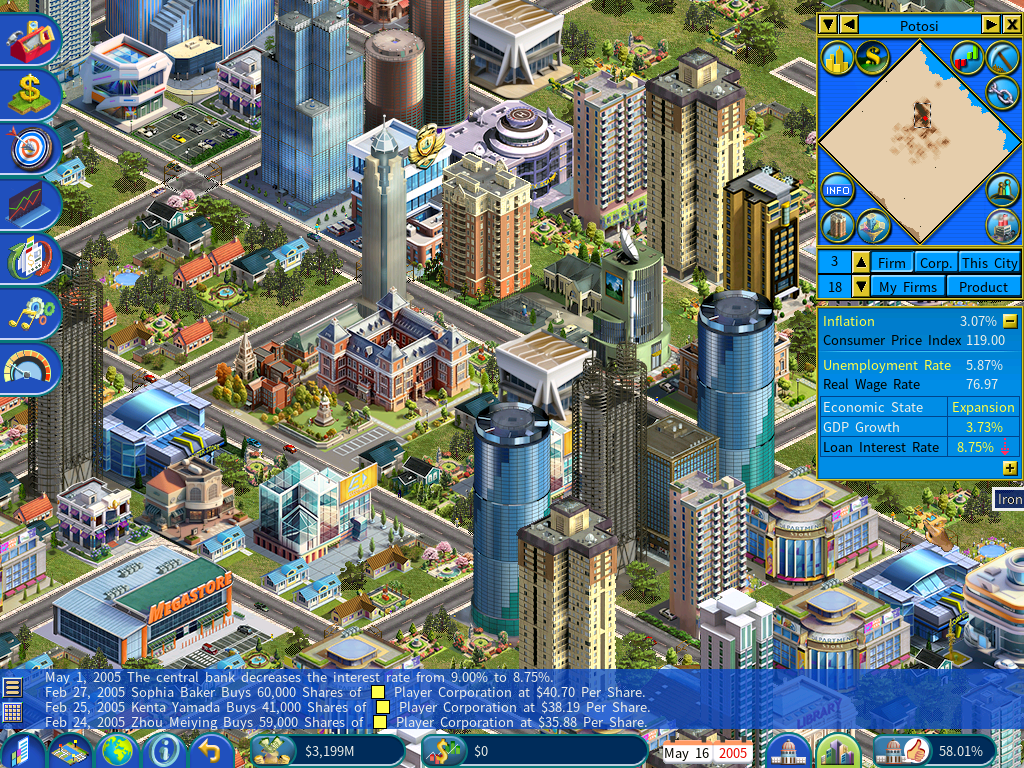
Here are some key points to note:
1) If you’re building a city from scratch and there are no commercial buildings yet, the CBD will not be established, so the red dot won’t appear on the minimap.
2) The location of the CBD is not fixed. A new district can become the CBD if it develops a higher concentration of commercial buildings and achieves greater prosperity, as indicated by its land value.
