
Nation Report
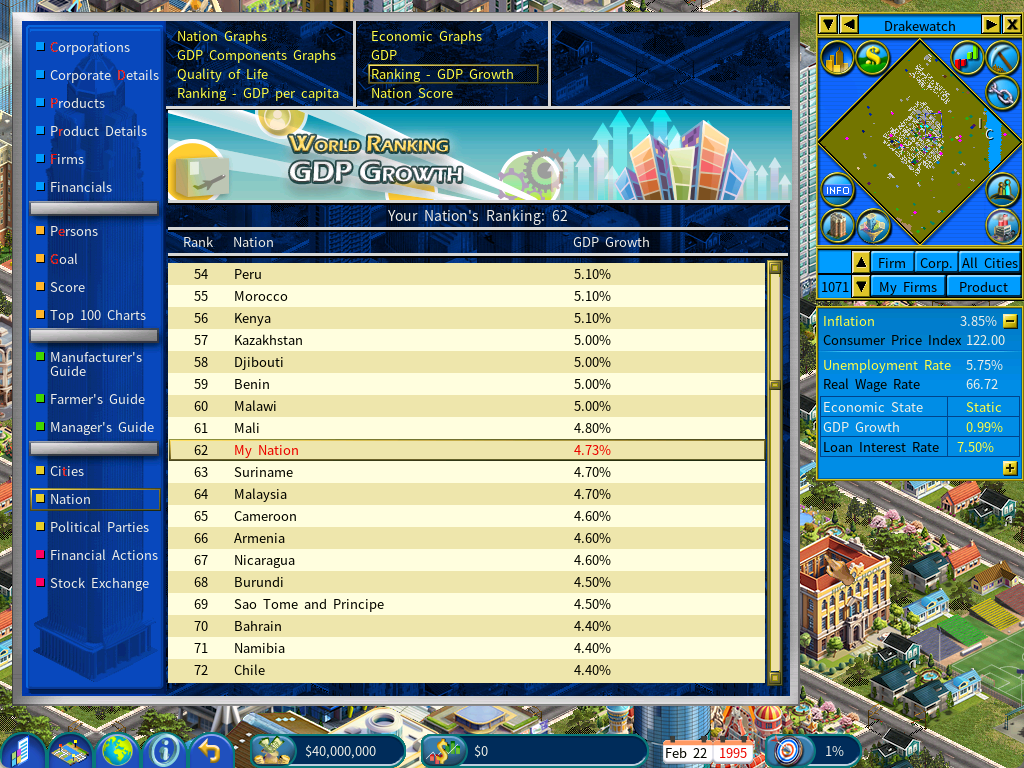
One of your main goals in this DLC is to grow your nation onto the World Ranking charts — the GDP Growth chart and the GDP Per Capita chart.
Your nation’s figures are the sum of all your cities. To see where a number comes from, look at the individual cities in the Cities report.
Judging the economy
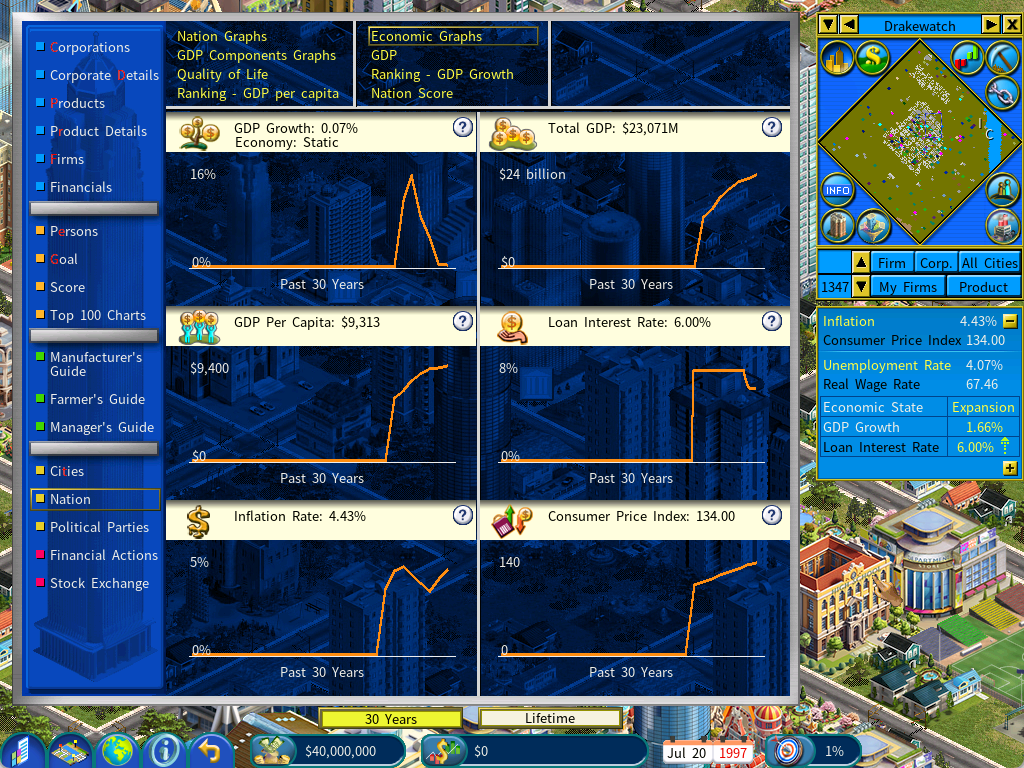
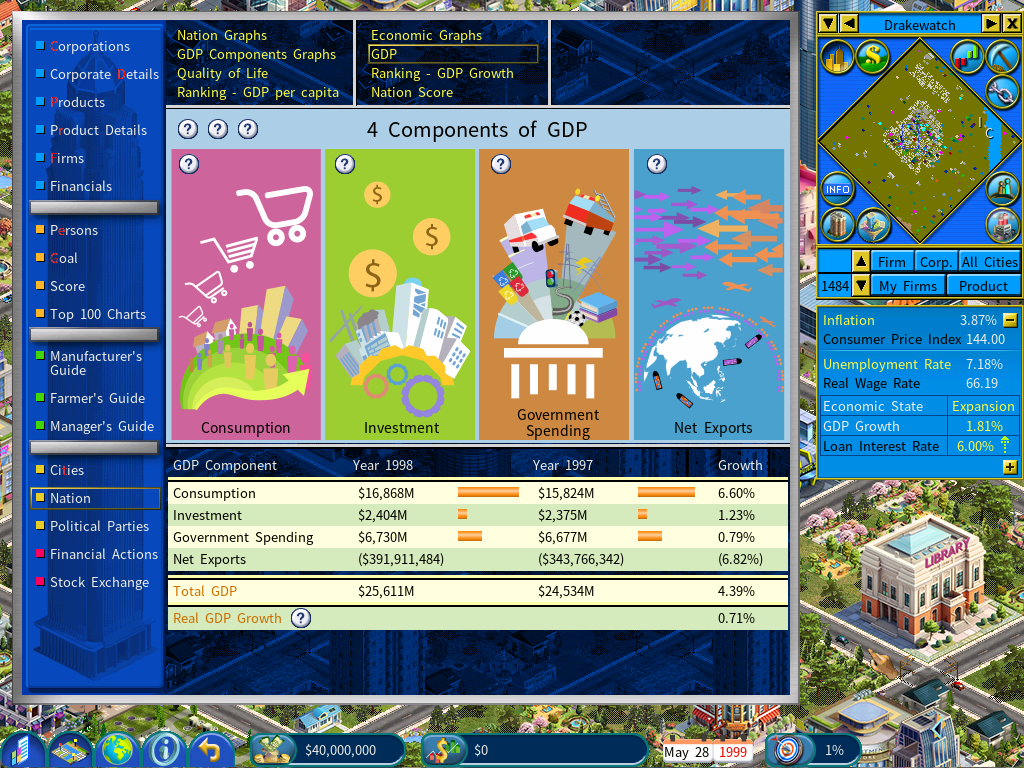
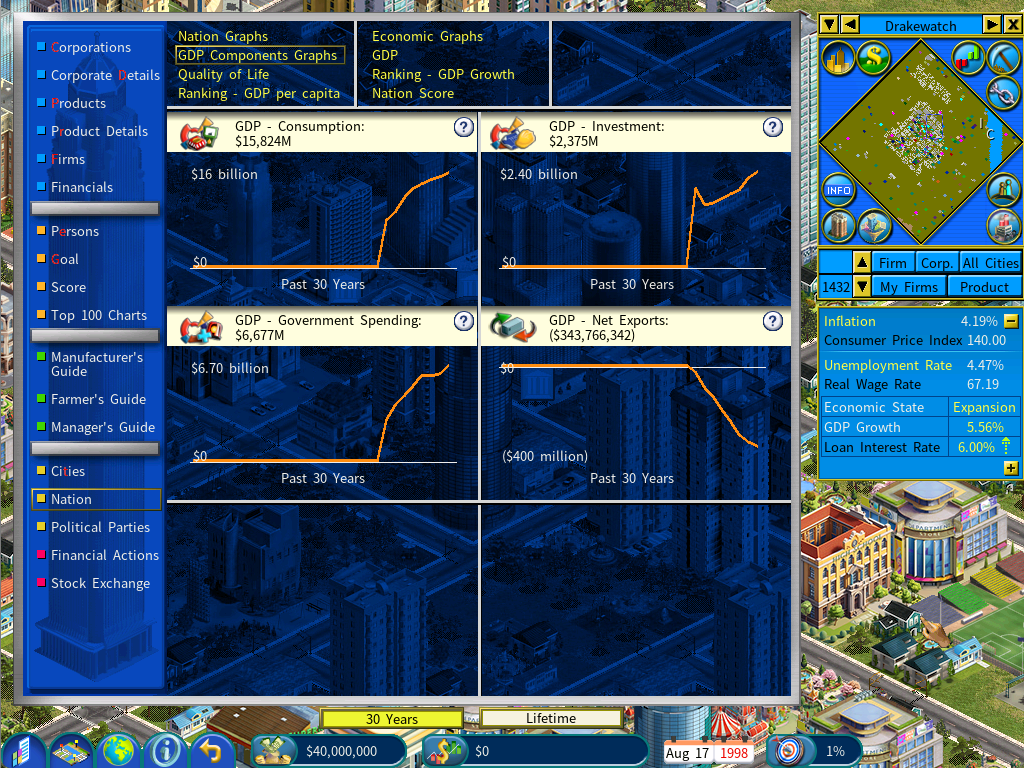
Three views cover your nation’s economic health: the Nation Economic Graphs, the GDP report and the GDP Component Graphs.
Quality of Life
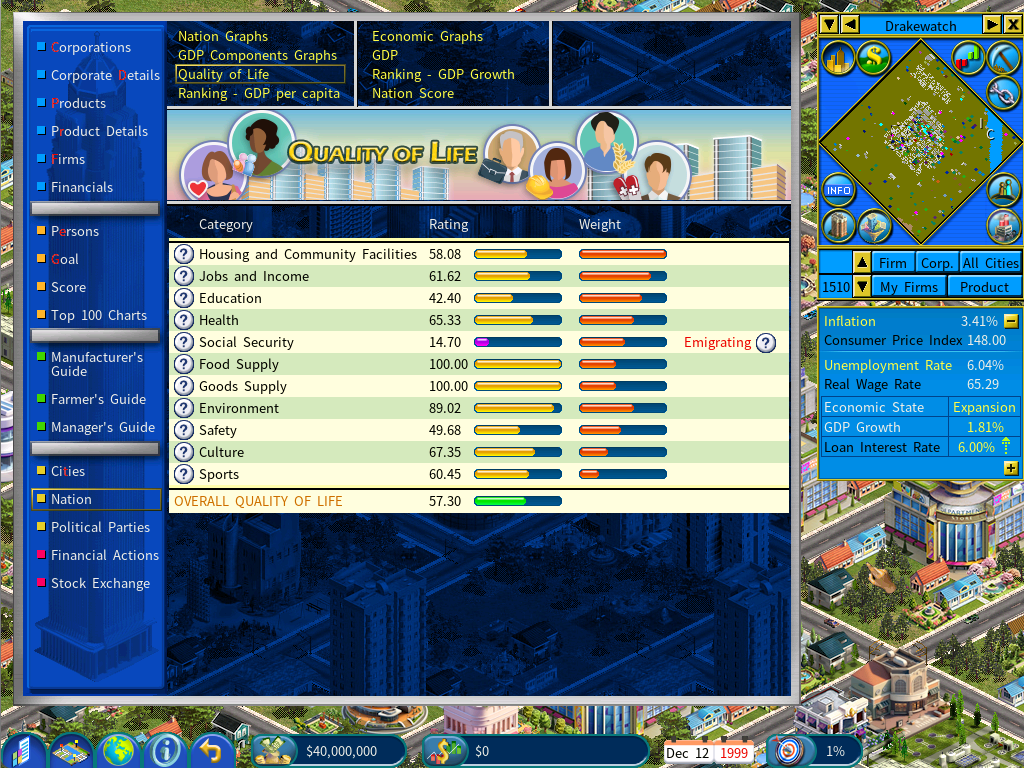
The nation’s Quality of Life index and the components behind it are in the Quality of Life report.
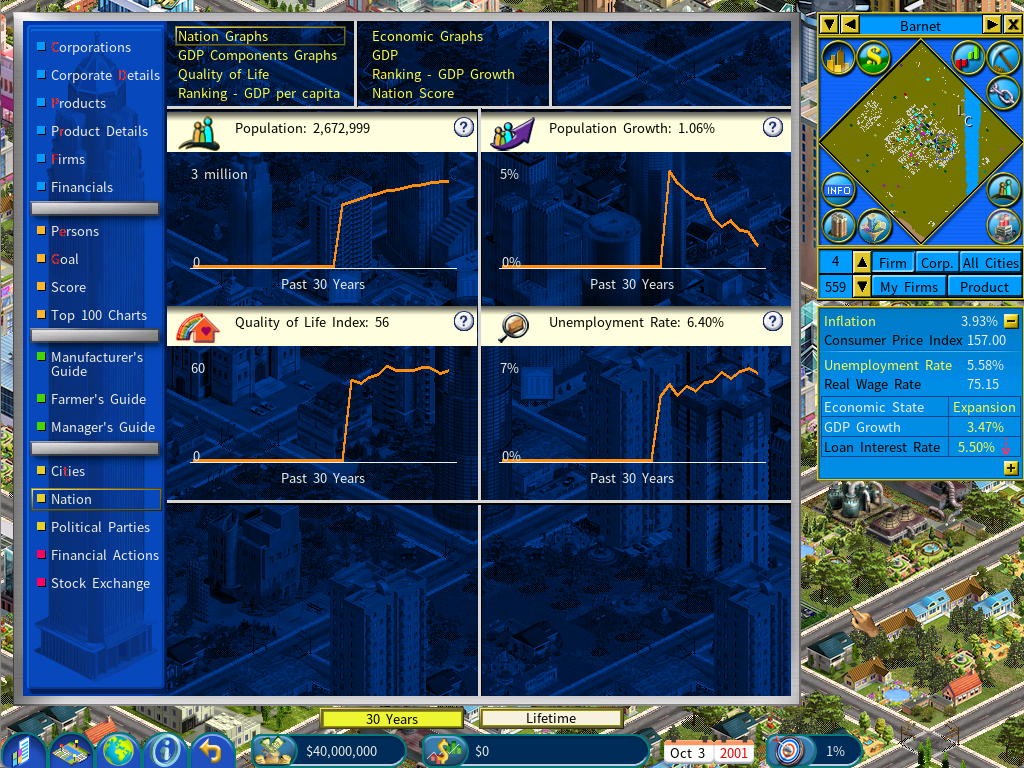
How that index has moved over the years, together with population growth, is in the Nation Graphs report.
Nation Score
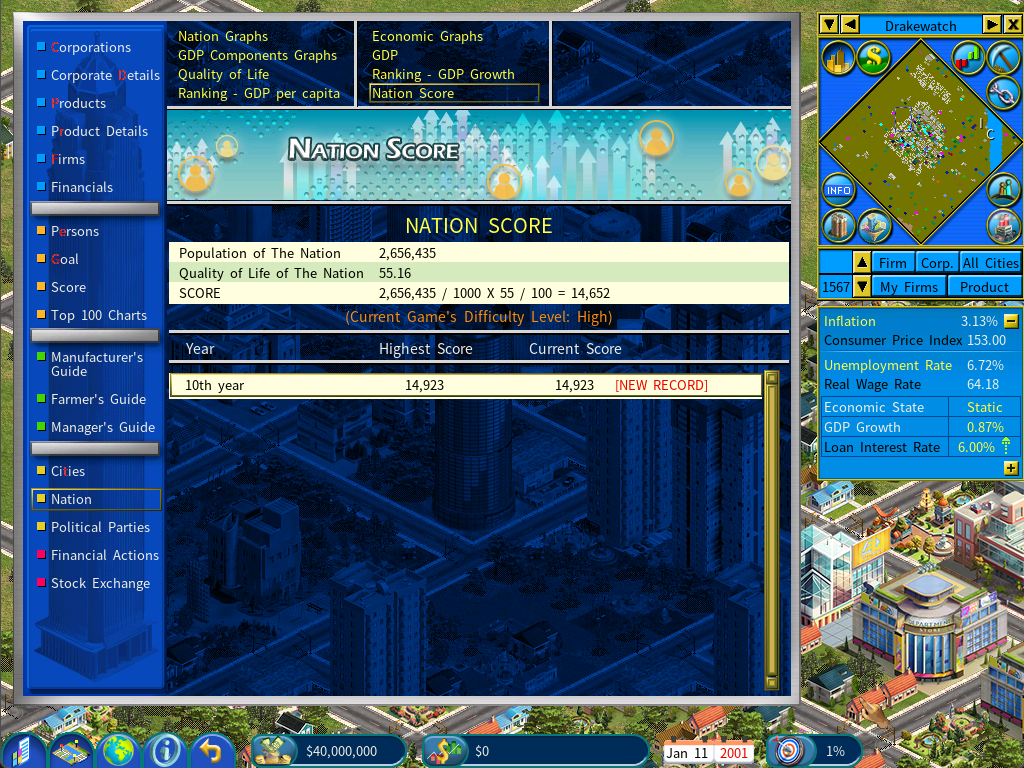
Your nation’s success comes down to its Nation Score, calculated from two things:
- the nation’s population
- the quality of life of its citizens
The report also keeps your highest scores on record, so you can measure current performance against your own best.
The objective is simple to state and hard to do: grow the cities in your nation, and push the Nation Score as high as it will go.