

City Dynamics
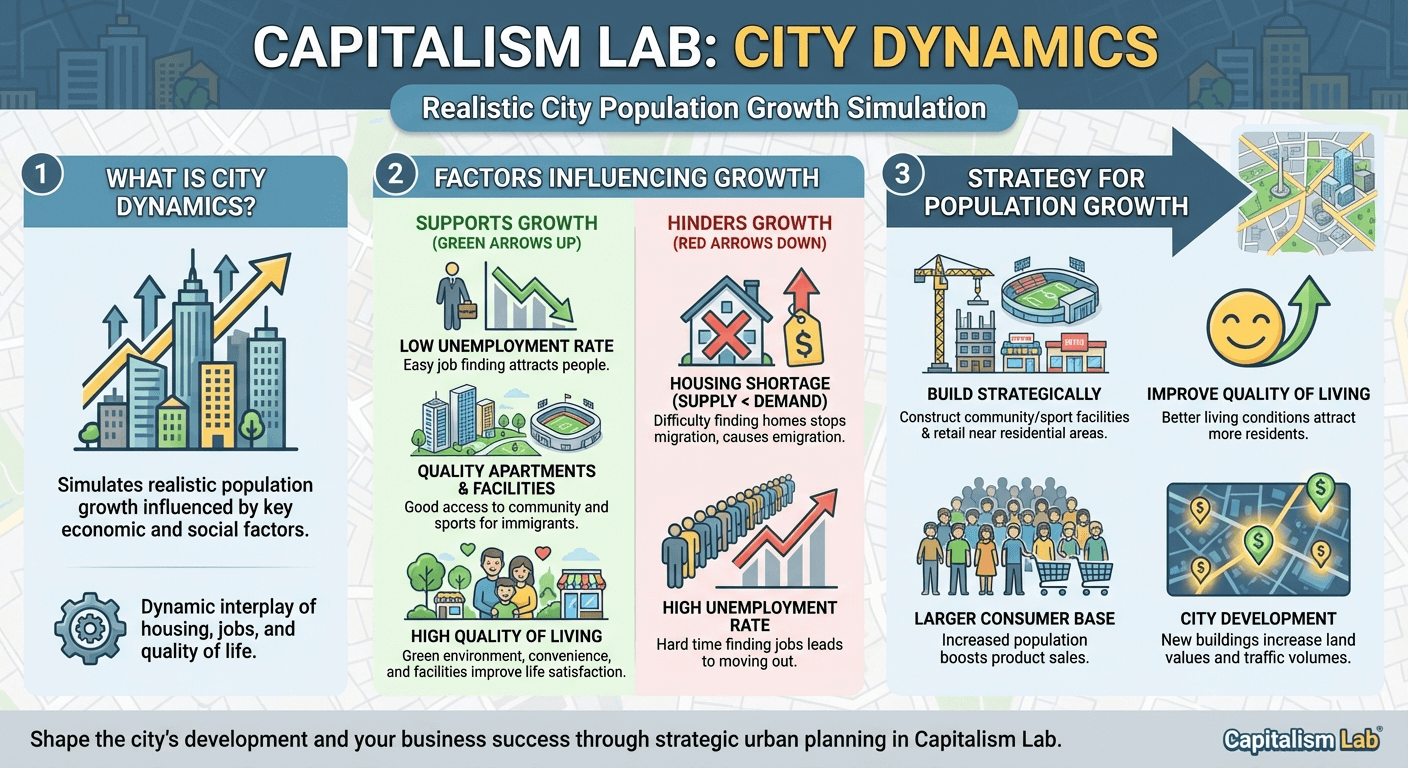
City Dynamics simulates a city’s population growth realistically — driven by housing supply and demand, the unemployment rate, and quality of living.
What supports population growth
- A low unemployment rate.
- Apartment buildings with good access to community and sports facilities, housing new immigrants.
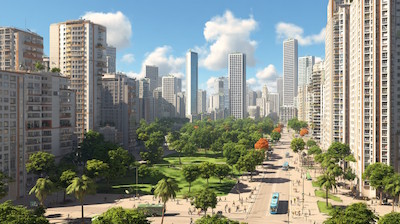
- Quality of living — people live better with community and sports facilities nearby, a green environment and shopping convenience.
What stops it
Population growth stalls, or slows to a crawl, in two situations:
- Housing supply well below demand. People cannot find homes, stop migrating in — and some emigrate.
- A high unemployment rate. People who cannot find work move out.
Growing a city deliberately
Build community and sports facilities and retail stores around the residential areas. Better quality of living promotes population growth, and a larger population is a larger market for everything you sell.
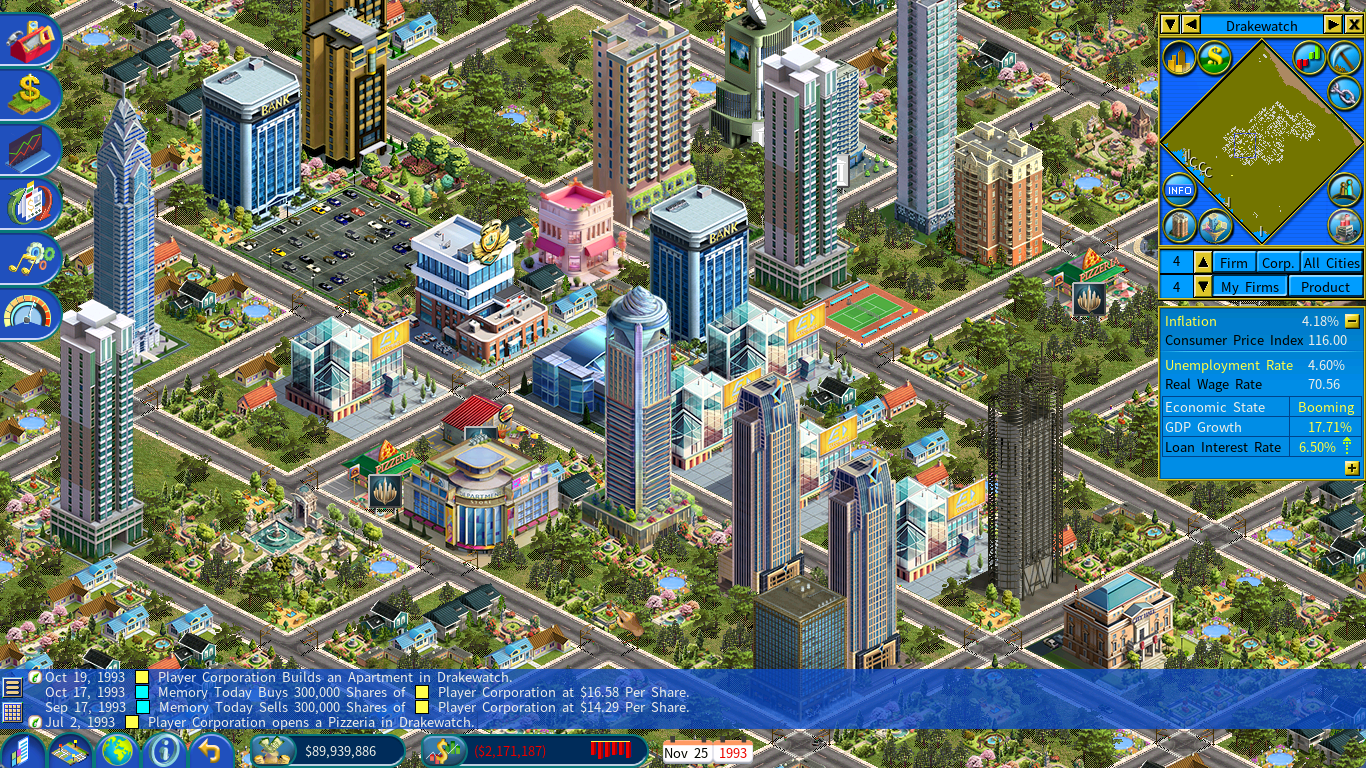
Every building shapes the city — yours and the AI companies’. Land values and traffic volumes both rise in areas where new buildings go up.
Reading the city
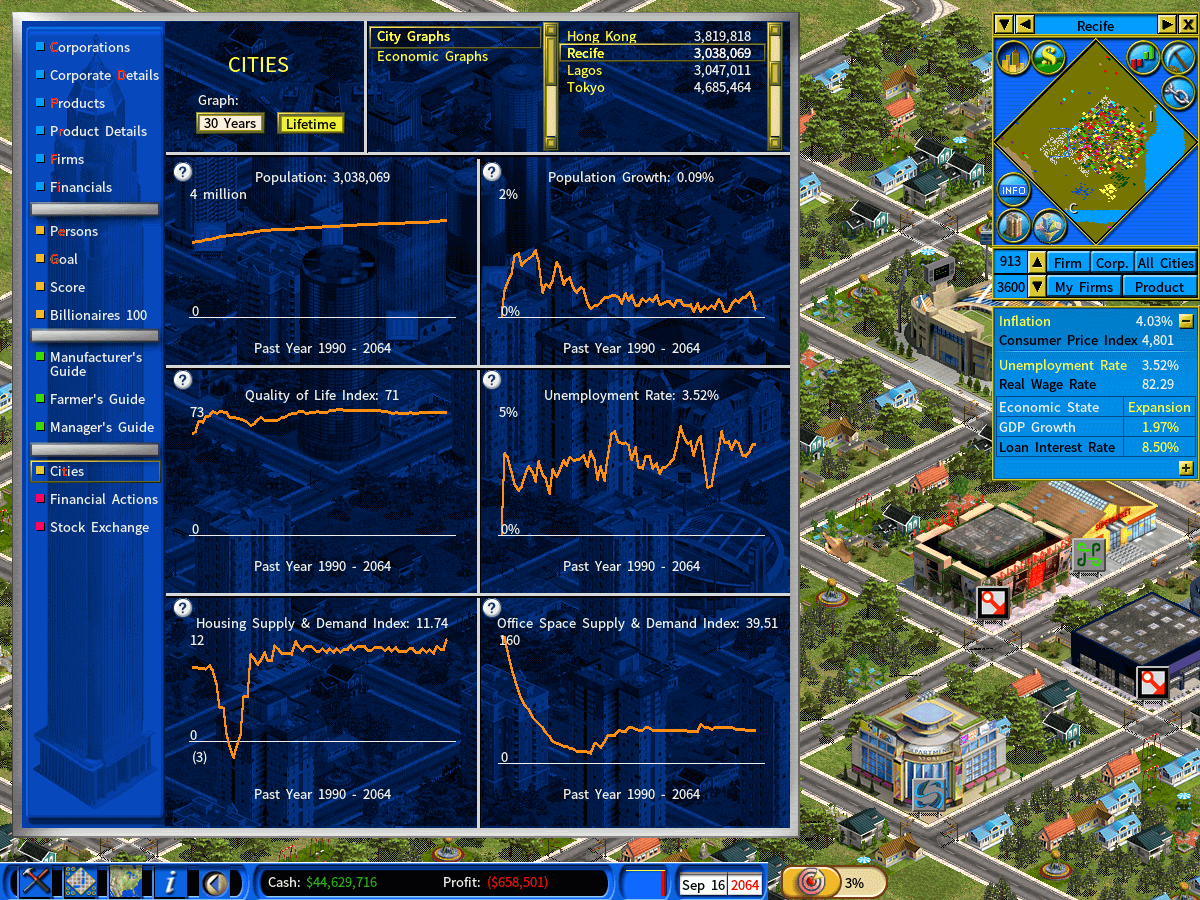
The Cities report carries two pages of graphs, reached by the City Graphs and Economic Graphs tabs. Both plot the past 30 years by default — switch to Lifetime for the whole history of the game.
City Graphs
The six that describe the city itself — its people, and whether there is room for them.
| Graph | What it tells you |
|---|---|
| Population | The headline figure. Read it against the graphs below to see why it is moving. |
| Population growth | The rate rather than the total — the first place a problem shows up, well before the population itself falls. |
| Quality of Life Index | How good the city is to live in. The main driver of whether people move in or leave. |
| Unemployment rate | Falls when businesses are expanding and hiring. A high rate pushes people out of the city. |
| Housing Supply & Demand Index | Positive means surplus housing; negative means shortage. A negative figure caps population growth however good the city is otherwise — there is nowhere for new arrivals to live. |
| Office Space Supply & Demand Index | The same measure for office space, and a direct read on whether building commercial space would find tenants. |
Economic Graphs
The second tab covers the economy the city runs on.
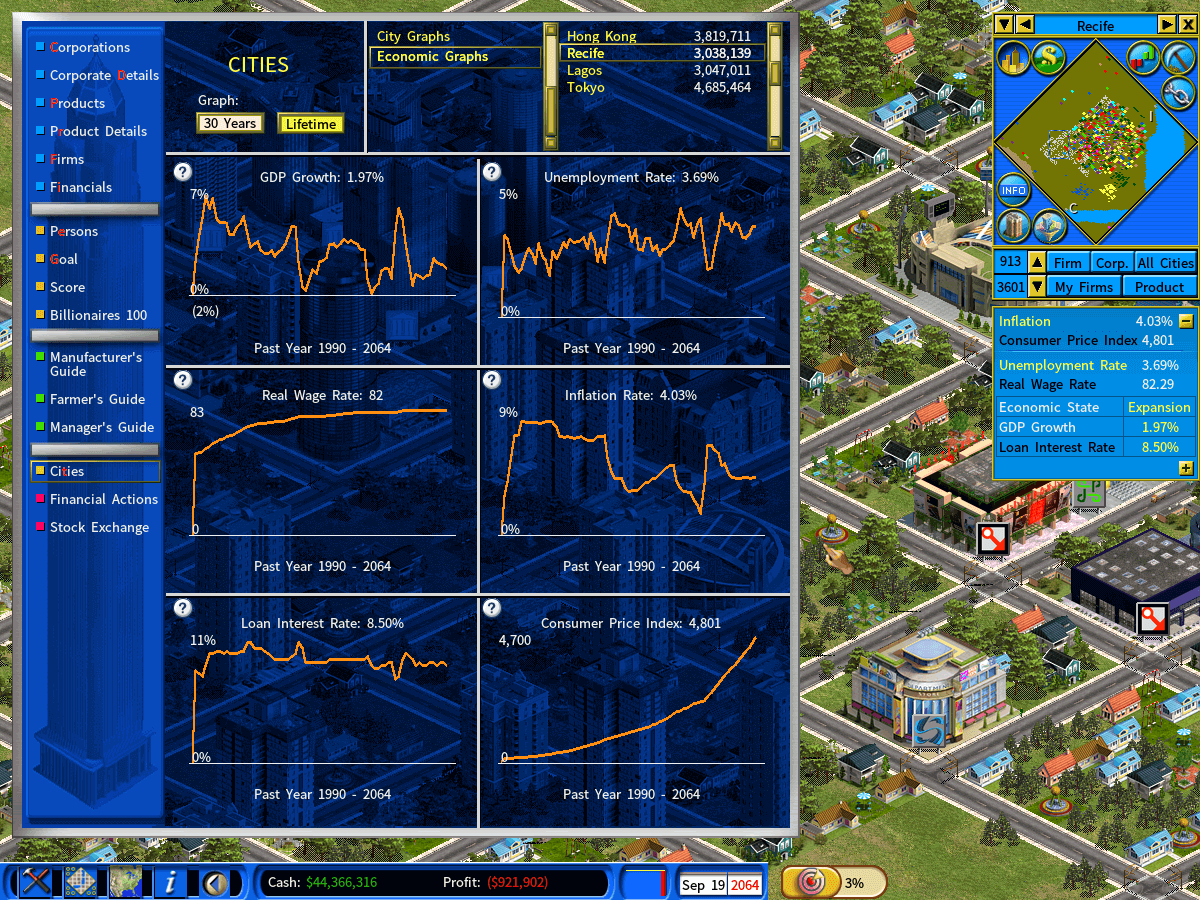
| Graph | What it tells you |
|---|---|
| GDP growth | The pace of the city’s economy. Sustained growth lifts wages and employment behind it. |
| Unemployment rate | Repeated from the City Graphs tab, so you can read it beside GDP growth rather than switching back. |
| Real wage rate | What people actually earn. A rising wage rate is what lets them afford higher-value products. |
| Inflation rate | Watch it against GDP growth: strong growth tends to pull inflation up behind it. |
| Loan interest rate | What borrowing costs. It rises when the central bank moves to control inflation, so this graph usually lags the one above it. |
| Consumer Price Index | The cumulative effect of inflation. Where the inflation graph goes up and down, this one only climbs — it is the price level, not the rate. |
Also see
- The Evolution of Shanghai from 1990 to 2010 — a scenario where you acquire a large piece of land and develop a new residential area from nothing. The city’s improved quality of living is what drives its population growth over the period.