

Enhanced Macroeconomic Simulation
The economic simulation engine tracks a set of macroeconomic indicators, shown in the window below the mini-map.
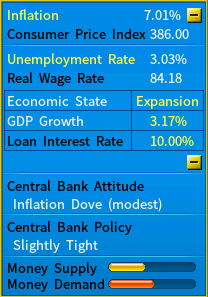
The economy drives consumer demand
Consumer demand is not a fixed backdrop you sell against — it moves with the state of the economy. In an expansion, low unemployment and rising wages put money in people’s pockets and they spend it. In a downturn the same shops see the same products go unsold.
That is why the indicators above are worth watching even when you are running an ordinary retail business: they tell you whether demand for what you sell is about to grow or shrink, before it shows up in your sales figures.
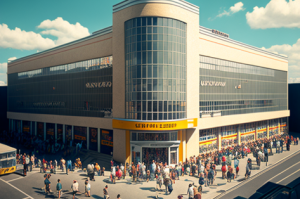
As incomes rise, luxury demand follows
What people can afford changes what they buy. A developing city — Shanghai in 1990, say — sees its real wage rate climb rapidly over the following decades, and as salaries rise, demand shifts up the value scale: from basics towards cars, video cameras and leather bags.
The timing is the opportunity. A luxury product launched before the wage rate supports it finds no buyers; launched as incomes climb, it meets demand that is only just appearing.
The Economy Report
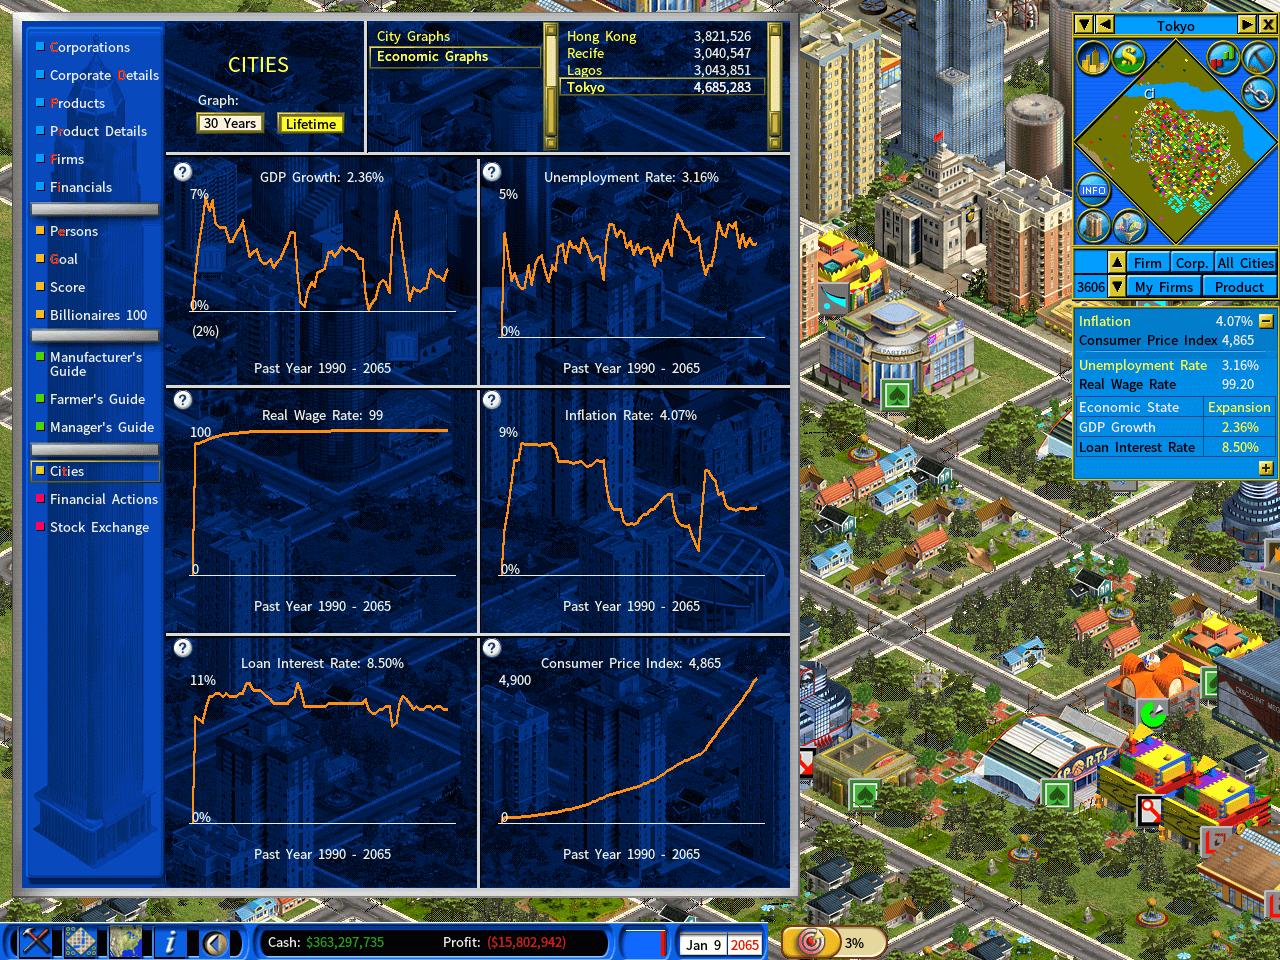
The Economic Graphs page of the Cities report plots the six indicators that describe the city’s economy. Both this page and the City Graphs beside it cover the past 30 years by default — switch to Lifetime for the whole game.
| Graph | What it tells you |
|---|---|
| GDP growth | The pace of the economy, and the driver behind most of the others. Sustained growth pulls employment and wages up after it. |
| Unemployment rate | Falls as businesses expand and hire. Low unemployment means more people with wages to spend. |
| Real wage rate | What people actually earn — the figure that decides which products they can afford at all. |
| Inflation rate | Rises when growth and spending run hot. Read it directly against GDP growth above. |
| Loan interest rate | What borrowing costs you. It moves when the central bank acts on inflation, so it lags the inflation graph rather than tracking it. |
| Consumer Price Index | The price level rather than the rate. Where inflation rises and falls, the CPI only climbs — it records the cumulative effect. |
Read them together, not one at a time. The sequence in these six graphs is the boom-and-bust cycle described below: growth lifts wages, wages fuel inflation, inflation forces the interest rate up, and the rate rise ends the boom.
The central bank and the boom-and-bust cycle
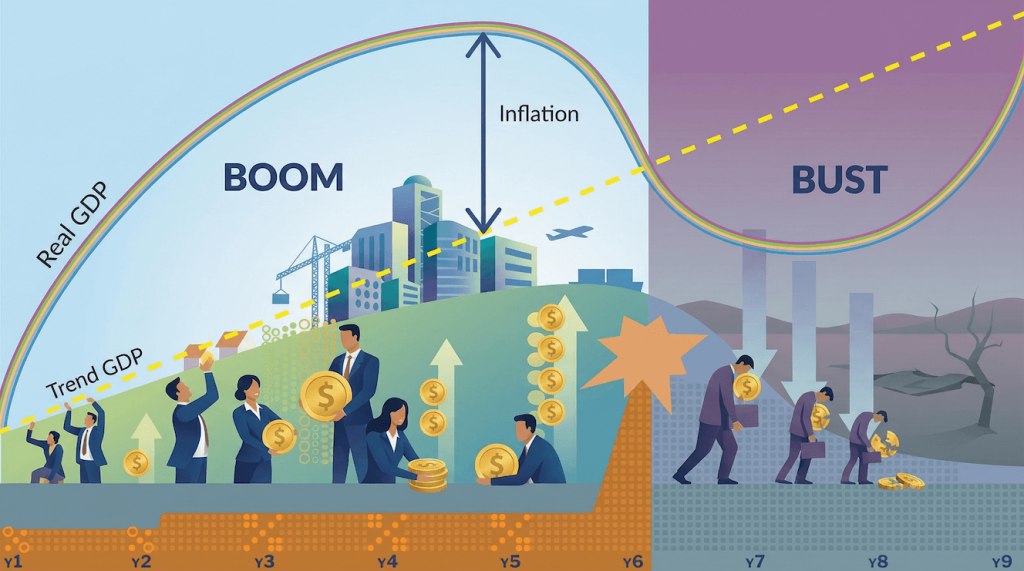
Bubbles in the stock and property markets can develop when the central bank runs a loose monetary policy — ample money supply and a low interest rate.

Stock prices meanwhile rise and fall with market sentiment, the macroeconomic situation, and the financial performance of the companies underneath them.
The cycle runs like this:
- High GDP growth and low unemployment reinforce optimism, and investors’ appetite for risk grows.
- Stock and property prices rally, which in turn fuels inflation.
- Inflation spikes to a dangerous level, and the government has no choice but to suppress it — hiking the interest rate and cutting the money supply.
- The asset bubbles burst, ending the boom.
And then it begins again. Years later, once inflation has been held low for an extended period, economic activity picks up momentum and the cycle restarts.
Also see
- Inflation Simulation — how inflation reaches prices, land, salaries and operating costs.
- City Dynamics — the City Graphs tab beside this one, covering population and housing.