

Community Let’s Play · Real-estate AAR
Office space — Part IV
In-game 2016–2030. The story of Tomahawk Corporation, a real-estate empire built on debt in the little country of Sylvania.
Continued from Part III. Originally posted by colonel_truman; reproduced in the author’s own words.
Chapter 57 — 7 October 2019
TECHNOLOGY.
We have slightly improved our tech chart to accommodate leading corporations inside it and also have included the technology ratio for each finished product. We too dropped the tobacco products from the list.
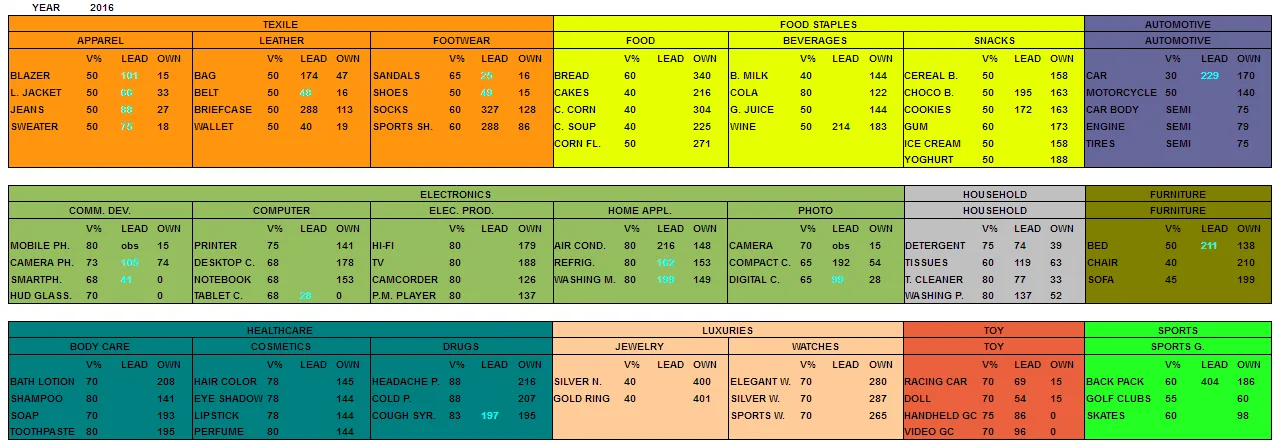
The lead space, if empty, means we are leading. If in bright blue means one of our subsidiaries has the leading product technology.
To summarize here, we are lagging (broadly) in:
Toys.
Leather&footwear.
Household products.
Toys: As shown in the Stock Market picture, we are investing by steps in the two toy producing corporations (Mankind and Tricubic). Both are feeling snug from their dominant position in their respective specialty product: the one in handheld consoles, the other in video game consoles. Our plan here will be to keep parking some of our surplus money in these, up until we get 50% of their stock and then buy the blueprints and start developing the products ourselves, without participating directly in the retail market. As we have already seen some other players probing the field, we'll keep an open eye in case the competition turns rough, in which case we will become net sellers. Only if we could take the lead in the technology we'd create our own brand of toys.
Leather&Footwear: In this case, both industries are split between two existing types of products: one with enhanced, saleable characteristics and another type that will require some improvements before an acceptable retail product could be produced (bags&briefcase + socks&sports vs. belst&wallets + sandals&shoes).
We'll review this sector later on.
Household products: We'll try to focus one of the universities into this category, choosing the one (Lynden) where our subsidiary Tidy Mart Inc. has its three R&D labs, before we set up our own.
Special Items: Digital Cameras; Smartphones; Netbooks and Tablet computers; Camcorders and Portable media players: Either us or our subsidiaries have the lead in this important range of electronic products, have the intention to keep it that way, and are also currently engaged in retailing them.
Finally: We decided to re-enter the cosmetics field through 4 new R&D labs in Funk, as the population and their purchasing power have grown considerably since last time we tried.
So, we will assess the possibility of creating a new subsidiary to focus on these products after we conduct a small "field" study.
REAL ESTATE.
We built 57 new apartment buildings and 17 new office buildings since 2012, having now a total of 219 and 148 buildings respectively through the nation. Our new "isolated" residential areas plan is having mixed results, as most of the new firms sprouting around these are research labs.
As it seems the process will take longer than expected, we will provide screenshots of the landscape in our next review. But yes, there are some retail stores already spicing up the new neighborhoods.
CITIES.
We regained Lynden's City Hall and had the opportunity before the elections to shuffle around the candidates of our political party. We needed Flemming Muns to direct our computer subsidiary (He was one of the Mayors) so we had to fund another candidate from scratch. Total campaign costs were about 100mm$, provided by Rock Smelters Inc.
Management: Back in 2012 we decided to run deficits so the cities would burn through their cash reserves. We did this by lowering taxes a bit but mostly through increasing the number of public facilities (esp. education). As we want to adopt a comprehensive policy now we decided to create a brand new chart to guide us through, as a new toolbox.
The data is from the 2015 budget.
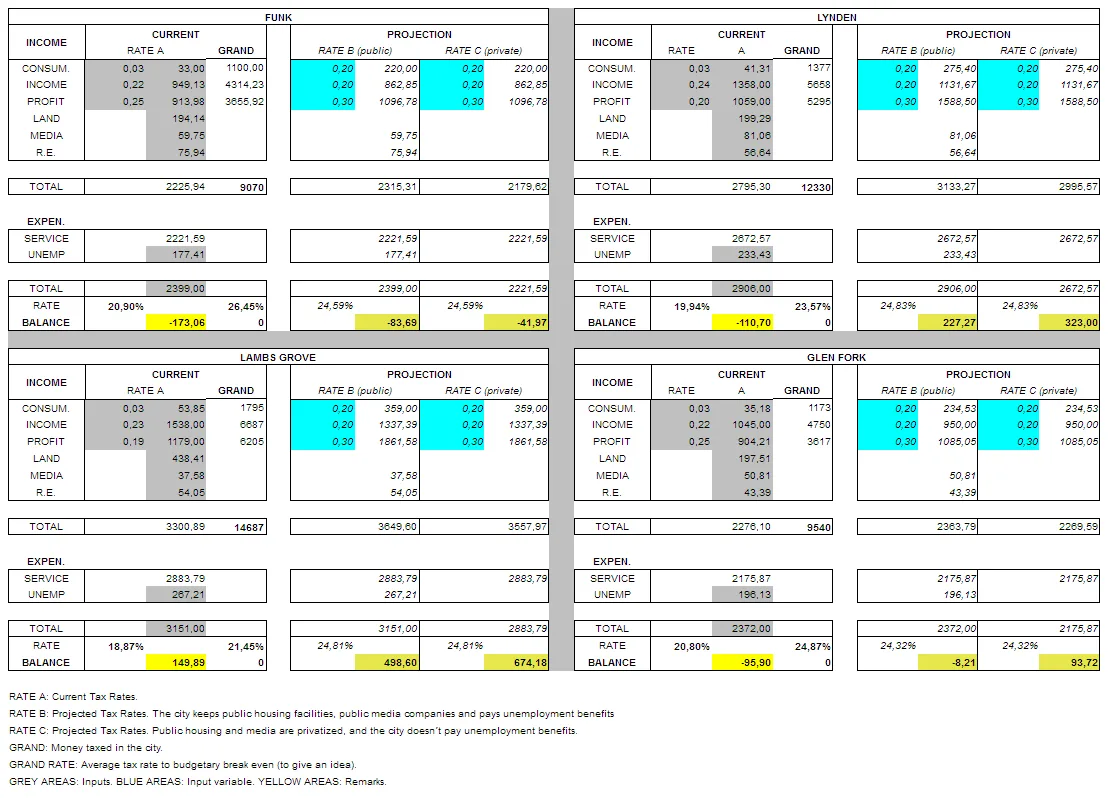
As you can see, only Lambs Grove is showing a surplus with the current tax rate, and that just because of the land SALES income (not land tax, 438mm$, twice the norm).
We thought the first step should be to assess the money that the city could GRAB, and from there decide what tax rate would make the current budget break even.
Then we decided to create two projections considering the breakeven number: RATE B (social) & RATE C (liberal). For now we will stick to the first.
We too considered to make the income&jobs category (in the living standard) to go from the current 80-something to 100 (max.). To do so we should lower current income taxes just a bit.
In that case the closer round number would be a 20% income tax. From that figure come the other two: increase consumer taxes to the 20% max. and from there we infer that the corporate profit tax should move to the 30s%.
With such a policy we see Funk and Glen Fork incurring deficits, Lambs Grove and Lynden surpluses. But, we haven't considered land sales, and as long as there are some we think the budget will be OK.
Consequences: we will try to monitor the effect this new policy will bring on corporations, as the consumer tax will affect retail sales, and the profits tax will supposedly reduce private investments. A change in valuations will probably have some benefits.
On the other hand, we will use the surplus (esp. in Lambs Grove) to further increase the education budget.
Finally, we wont carve these rates into stone, and will probably come up with somehow lower taxes.
Chapter 58 — 11 October 2019
TEXTILE INDUSTRY:
We have tried to created a picture that would give the most information with the less inputs, so we 're going to focus on what we think are the strategic mistakes and strenghts of every one of the players. It will be a small summary of what we see here.
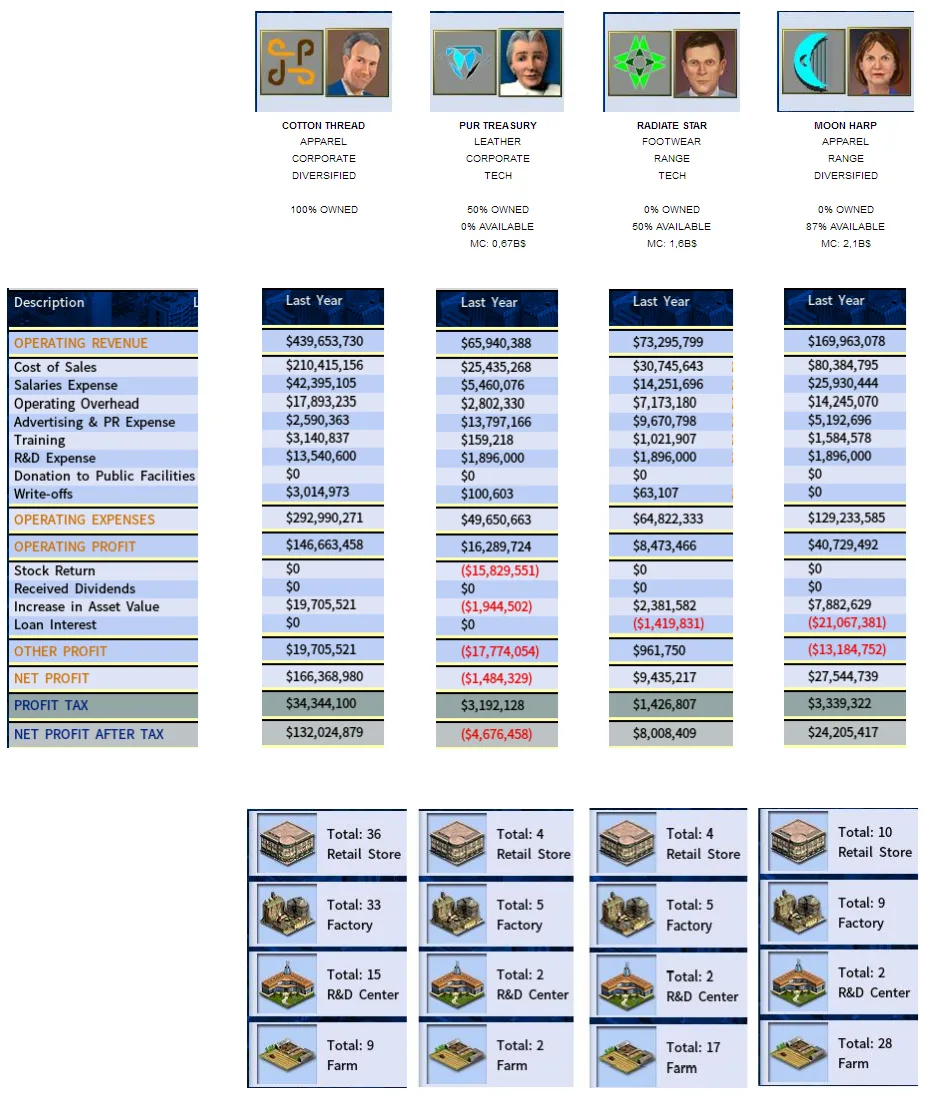
Mistakes:
1- COTTON THREAD: They are involved in manufacturing microchips and the lot, in size! Probably because of the predesigned layout factory plans? We indicated them to close down unprofitable firms.
2- PUR TREASURY: As they're small and focused, the CEO "forgot" to buy 50,01% of the company shares and so they became part of our holding emporium, when they could be independent.
3- RADIATE STAR: They have lost their purpose of being a tech company as they have directed their resources massively towards farming. That gives them size but makes them less profitable. Also, the CEO doent's have research skills, so it will be easy to dislocate them from their tech leading position in footwear goods (by finding a good research project director?).
4- MOON HARP: They too have massed their resources towards farm production, and a few resource-extraction facilities, so they find themselves losing half their profits to the banks.
Now to the strenghts:
1- COTTON THREAD: They are researching 12 of the possible 12 consumer products, with a qualified CTO (40 skill, leather), and focus on retailing aggressively.
2- PUR TREASURY: They are efficient, and have decent tech potential.
3&4- They will get in the long run good quality raw materials (leather, wool etc.), and these are as important as technological advances for the textile class products.
In a nutsell, it seems tech vs raw materials.
Observations:
We lead in profits, so we'll grow bigger, faster that our opponents, for now.
There are imbalances between farm-semis materials and consumer-goods factory production (farm overproduction). There are also imbalances between consumer-goods factory production and retailing capacity (low retail infrastructure).
Cotton Thread aspires to dominate the full spectrum of the industry.
Our opponents are big size/low profit, and are "big caps" (too expensive to purchase, but not out of reach).
In January 2017 our 3-year textile-research investment will bear fruit and we will have the lead in sandals, shoes, wallets and belts (We started it at the beginning of 2014). Most of that market share is still dominated by the local producers.
NEW VENTURES:
After checking semi-product supply, local producers quality and our current tech level, we think we could run a cosmetics focused corporation succesfully.
For that we will need 500mm$ and an enterprising CEO.
Also, maybe a retail-focused subsidiary will do some good. It could help some struggling factories to deploy their merchandise.
In our "field" trip we found that many factories are big size, and that many products can't make it to the shelves as fast as required.
We'll need another 500mm$ and a CEO with good retail skills, and we will manage personally the location of the stores, as we want to test a 6×6 retail mall comprised of 4 department stores grouped together. We'll leave the CEO to decide about the stuff to sell and the price tags.
OLD VENTURES.
We made available in our last post a chart that covered how our subsidiaries are currently getting along (quite well, thank you).
We also suggested that an IPO wouldn't be off the table, as it could help Tomahawk keep some dry powder for big purchases later on, in case one of our creatures might need extra cash to run the business.
So, we used the "Corporate Market" chart and inserted a column to compare the possible money raised for each subsidiary to find out which one would benefit the most.
Probably, one good gauge would be to divide earnings to equity. We did so (far right) and found the following:
1-The ones with a ratio of 0,1 get good MC/EQ valuations.
2-Beyond that, exponentially good MC/EQ valuations.
3-Below that, it doesn't matter if they lose money as it is the same MC/EQ ratio.
Hmm.
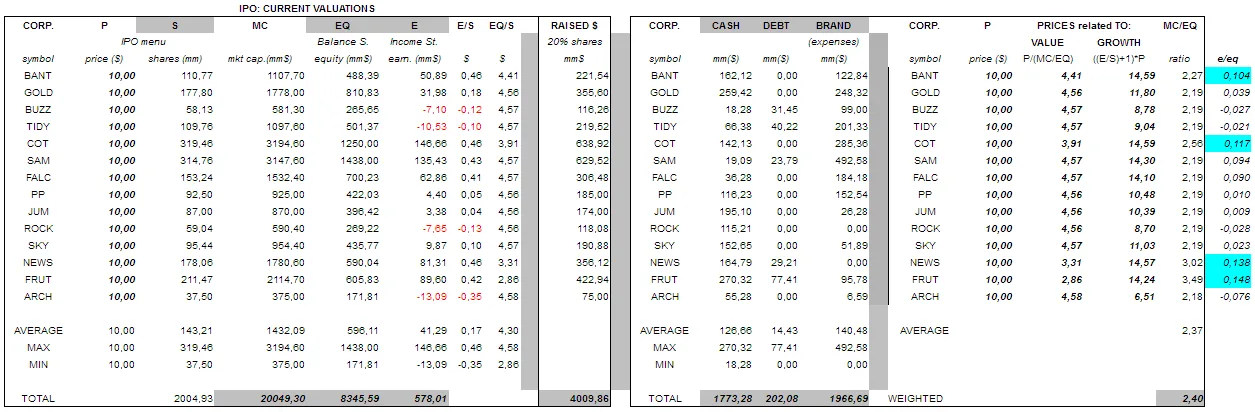
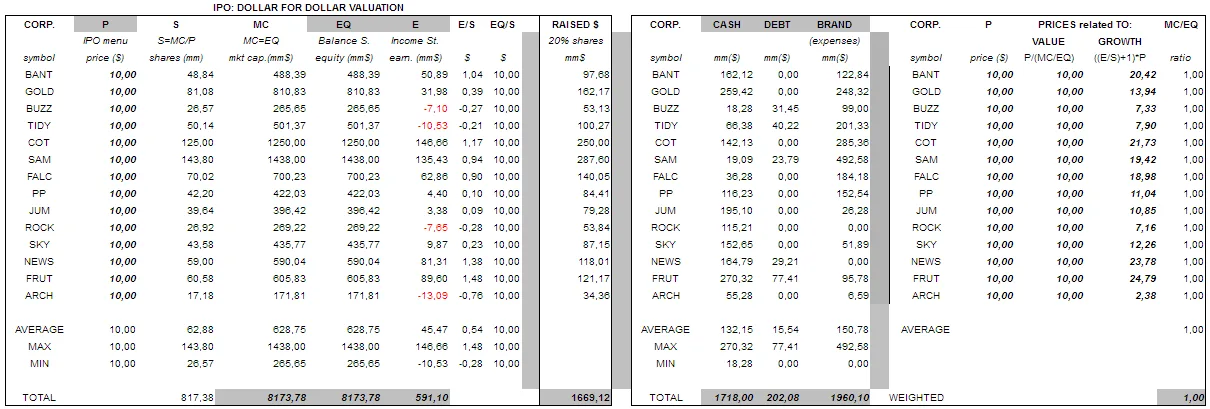
Well, we stopped there, but not before we'd check what a MC=EQ valuation would do to the quantity of money raised (maybe a good valuation for recession times?). We call it dollar for dollar IPO, as one cash dollar would give private investors one dollar worth of equity, regardless of earnings (just experimenting).
As the issue price is the same (10$) the variable is quantity of shares. Then EQ=MC, and so S=MC/P.
Result: They would get less than half the money from the current system.
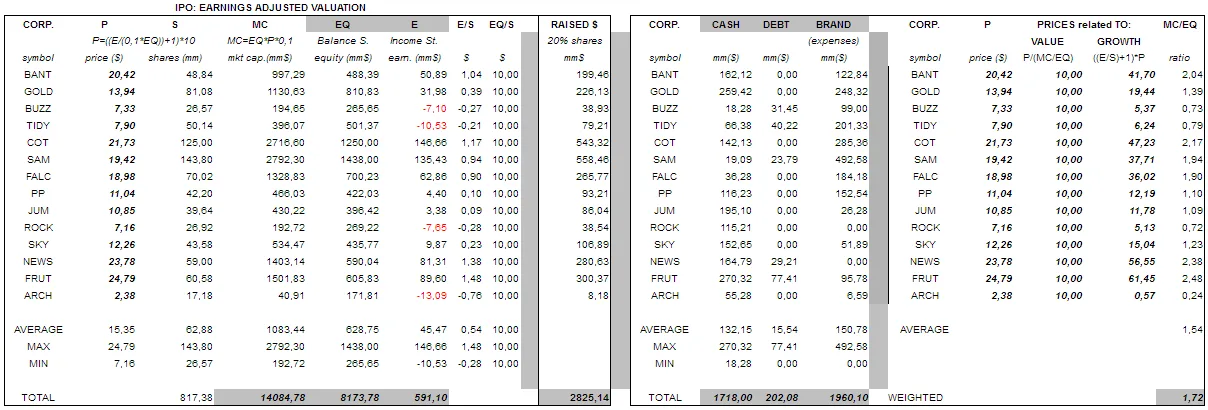
From there we devised an ideal plan, more to our liking, where earnings mattered more and money losing operations would get much lower private investment.
Also, we thought of some way to make the IPO price different from 10$ for each corporation (depending on their level of success) without dropping the idea of having an E/EQ ratio, so we reached the "enhanced" formula: P=((E/(0,1*EQ))+1)*10
From there you get the MC: MC=EQ*P*0,1 or MC=EQ*10E
Then you get the quantity of shares to issue (if 20% issuance), and all the other ratios.
Just throwing numbers at an excel…. and correct me if wrong.
Here are the results:
Chapter 59 — 12 October 2019
BEFORE WE CONTINUE….
I forgot to mention that we created a new subsidiary for the sport equipment field: Archer Sport&Fitness Ltd. with 250mm$ as starting capital. Est. 2014.
We don't have very high expectations for these folks, but we thought it was worth to give it a try.
Alright, let's see what we've done just after reporting and before we start playing the next period:
1-Changed taxes: finally we opted for a 15-20-25 tax instead of a 20-20-30.
2- Increased Immigration cap to max.
3- Changed university research focus globally, esp. Household products in Lynden, and stopped the focus in Funk (temporarily).
4- Built a few public facilities, changed the budget in others.
5- Created 2 new subsidiaries: Le Chandeliere Stores Ace HELP Products Ltd. (cosmetics) and The Four Corners Mall (pure retailer).
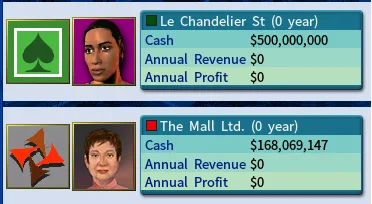
The Mall has already 16 department stores and enough land to build 16 more.

5- Hired a CTO for 45mm$/year (Mr. Fandango) with a research skill of 40, and had to re-start most of the research projects so the CTO's skill was reflected in the final numbers.
6- IPO'd Tidy-Mart, Buzzard Automotive and Saratoga Mills, for the following reasons:
a) Both Tidy-Mart and Buzzard were good enough to IPO despite losing money, as we indicated.
b) Saratoga Mills invests a lot in new production facilities and so after earnings is usually "cash flow neutral".
c) All needed quite some cash to purchase our latest technology.
The money raised can be found in our last post inside the "Current Valuations IPO".
We then sold 5% of their shares to raise some cash ourselves and still keep our interest at 75%.
7- Sold our most recent tech to the subsidiaries that most needed it; Purchased smarphone, digital camera and tablet computer technology and added R&D labs for these.
8- Finally, our debt increased to 2 billion$ (give or take) after the adjustments.
Finally, a couple of comments:
a) We didnt talk about interest rates this time: As lower rates didn't materialize as expected, we decided to err on the side of prudence about our liabilities book. Also, we decided not to purchase extra land, but that will change if we find the cities struggling financially.
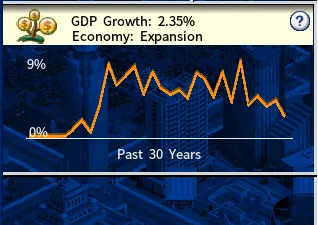
b) We are doing everything we can think of to boost Sylvania's growth by monetizing our properties and using the cash to set up performing businesses, but we have been witnessing a decrease in the rate of national economic growth, esp. in Lynden these past years where the conservative party was managing the city.
As the mechanics of the game are hidden, we can just say that expenditures in the public sector, private sector and overall consumption are not growing as fast as before.
We'll see if a recession ensues in the not too distant future or if we will enter into a period of sustained, albeit lower, growth.
Regards.
Chapter 60 — 20 October 2019
FEBRUARY 2020.
NATION:
Alright, first thing we want to find out if our new tax policies have affected the economy of the nation, and how. To recap here: we increased the consumer tax from a low of 3% to 15%, tried to lower the income tax below 20% (and failed) and increased the corporate tax to a flat 25%. We kept these rates more or less unchanged for 4 years from 2016 to 2020.
KNOWNS AND UNKNOWNS:
a) The first outstanding change was lower inflation, from 6,2% to 4,8%. At the same time the central bank increased interest rates twice, from 9,5% to 10,5%. That much now we know.
b) We must assume that the higher 15% consumer tax caused the inflation to drop, because our limited linear thinking says higher taxes mean higher prices, so lower spending?
So, were consumers spending less at the stores?
c) We also must assume that a higher corporate tax affected private investments negatively.
So, were corporations spending less in expanding their businesses?
To answer b) and c), we had to create a new chart, showing yearly changes in the GDP components.
The black vertical line marks the start of the period. Let's see:
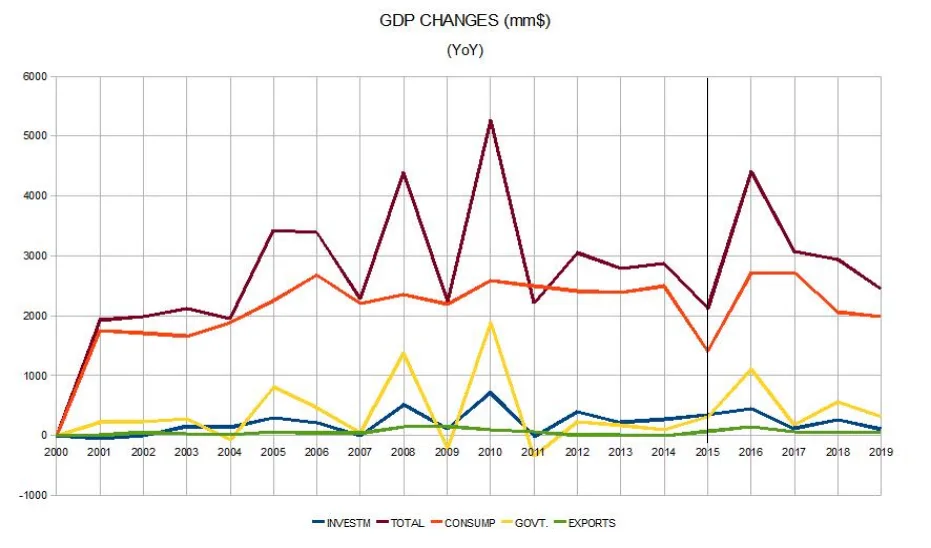
CONSUMER SPENDING (orange line) OBSERVATIONS: (forever increasing, always above zero)
a) You will remember that we were wondering about future growth when we finished playing the last period (feb. 2016, see the "slowdown" chart). Now we can see that the GDP% drop was due to a drop in consumer spending between 2015-2016 exclusively.
b) It seems that our 2016 investment in public facilities (yellow line) boosted consumer spending, to our surprise!
Another explanation for this YoY increase would simply be a normal recovery from already low levels, meaning what consumers didn't spend during 2015 they spent during 2016. BUT, we don't find such a strong peak anywhere else in the chart. The real reason might be hiding inside the retail stores world, but we can't think of a method to evaluate that option in any meaningful way.
At least this time around, and lacking a better explanation, we'll stick with public investment helping consumer spending.
c) We can see consumer spending still growing between 2018-2020, but about 10% less than the average.
To summarize: Did higher taxes affect consumer spending? It seems they did, albeit modestly.
CORPORATE GROWTH (blue line) OBSERVATIONS:
a) Judging from the private investment component going down since its relative peak in 2016 we can assume that corporations were placing some of their investments on hold during this period because of our higher taxes.
To summarize: Corporate expenditures are still growing, but less than before. Higher corporate taxes somehow restrain AI corporations from expanding.
In retrospect, we should have pushed it further and set rates at 30% as we planned.
We could try to assert our findings from another angle…
As the lower part of the chart is not very visible, we'll show you another chart! This time we threw in city land sales to the mix (yellow line).
As corporations must buy land to build new factories we infer that we should see lower land sales since 2016.
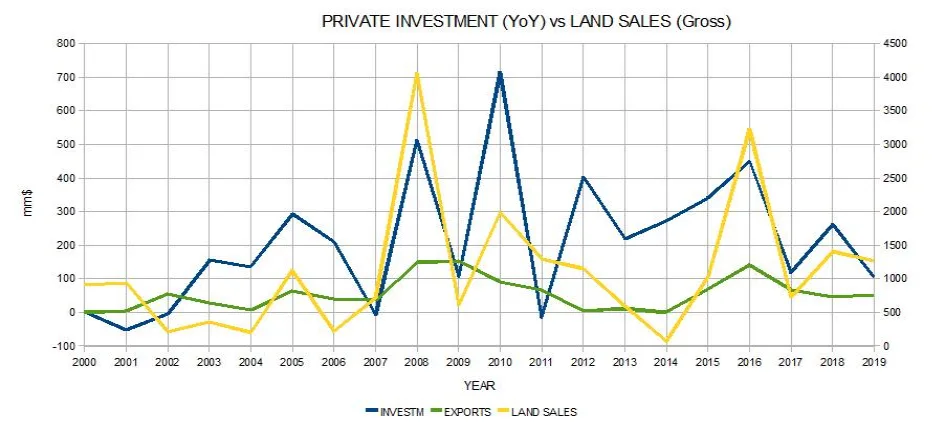
We have global land sale gross values on the right side.
You will notice that corporate growth follows quite neatly land purchases.
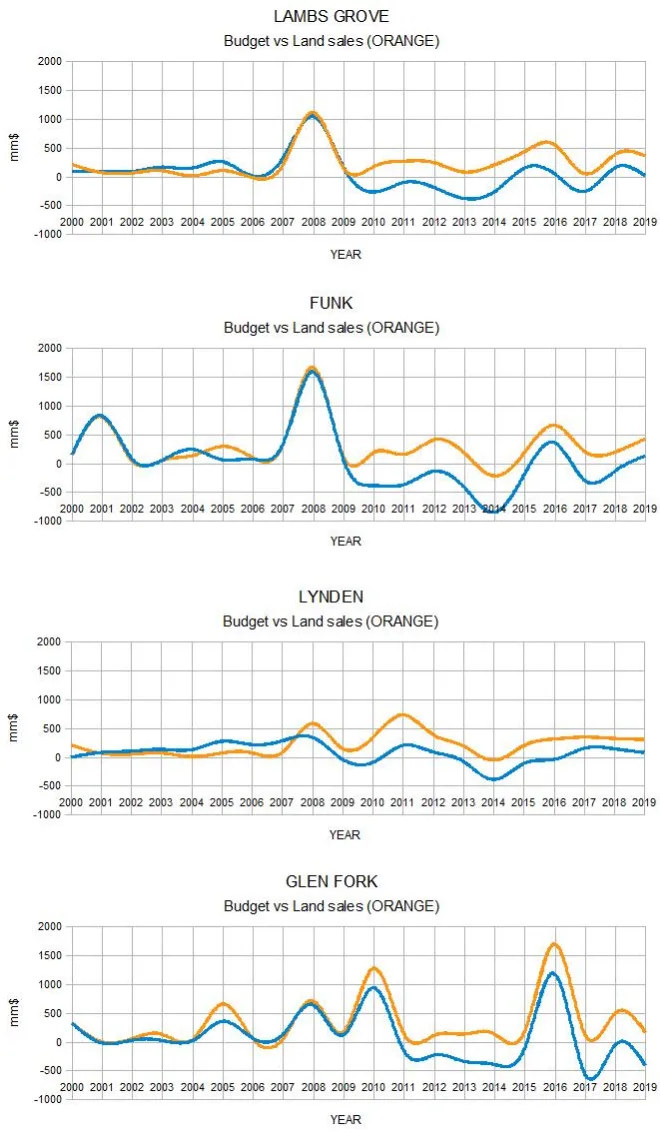
Finally, we made a third chart, where land sales are mixed in with city budget balances.
In these we can observe:
a) Where the budget was deficitary, in each city: We can see that 2009 was the year we decided to run budget deficits, except in Glen Fork where that took place two years later.
b) The gap between land sales and budgetary equilibrium (ideally, land sales better not be used to fund day-to-day expenses, in our humble opinion): Where both lines converge above zero, the city is properly taxed to run surpluses without abusing from asset selling. Later on we find big gaps between the lines, and on top of that budget deficits (blue line below zero), meaning the cities were undertaxed and burning cash fast, and so were "abusing" from the sale of their valuable assets.
Remember we have a way to prevent land sales through the urban planning toolbox.
c) Probably the worst case would be to have the orange line permanently below zero, as that would mean businesses leaving the city, with predictably dire consequences.
There have been a few years in which that situation happened, albeit sporadically, in some of the cities. In any case I'll leave that piece to our brave and idle readers, if they please.
How could we, corporate managers, do without statistics and a few charts!
Chapter 61 — 28 October 2019
Note before we continue:
We did some thinking about the jump in consumer spending that happened during 2016 and we can provide an alternative account: We lowered the income tax temporarily to between 16-18% as we tried to achieve a 100 rating in the income&jobs. That MIGHT have put some extra cash inside people's pockets which they diligently spent inside the stores.
We'll keep this in mind.
Now to our corporation.
FINANCES.
As we mentioned before, we noticed both a drop in inflation and an increase in interest rates early on. We then decided to get rid of our remaining debt, without making that our priority, and finished the process in early 2018.
In the Balance sheet you will notice that we currently have zero outstanding debt, but that we have made use of the revolving facility from time to time, mainly to purchase stocks in bulk when cheap.
You will also notice the huge increase (58%) in the value of our assets, from 22,5 to 35 billion$, and that the main component of these are stocks, for the first time (about 60% of the total).
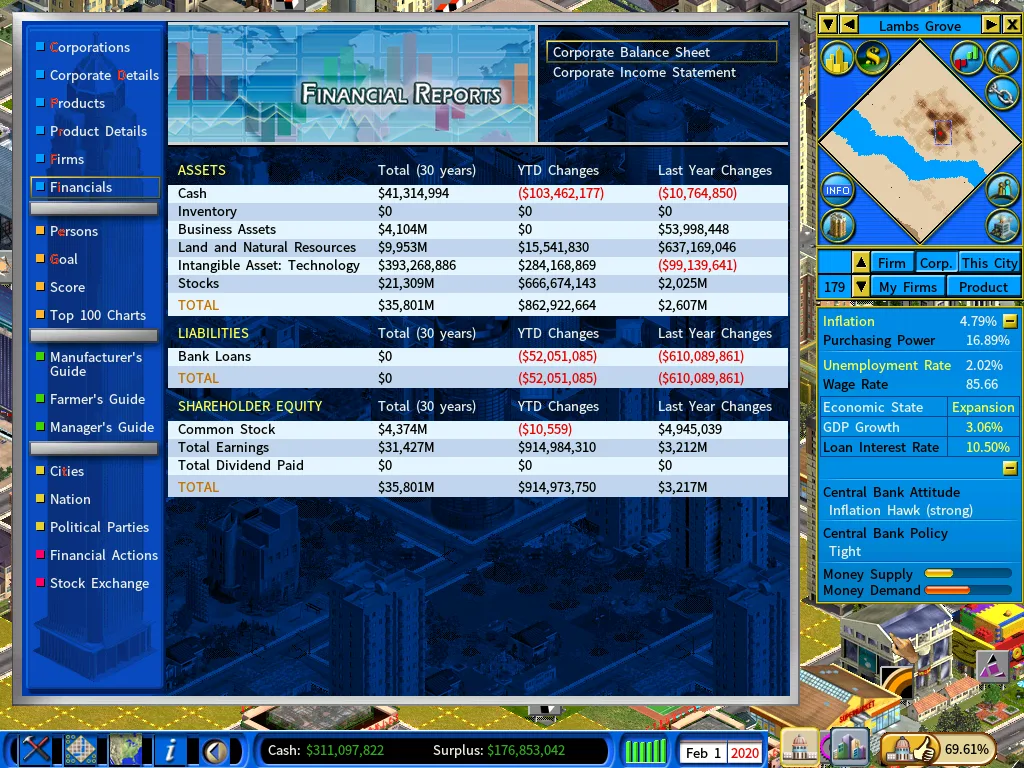
Our net income increased by 19% to 1,5 billion$/year.
Also, our R&D expenses have increased as we built a few extra labs.
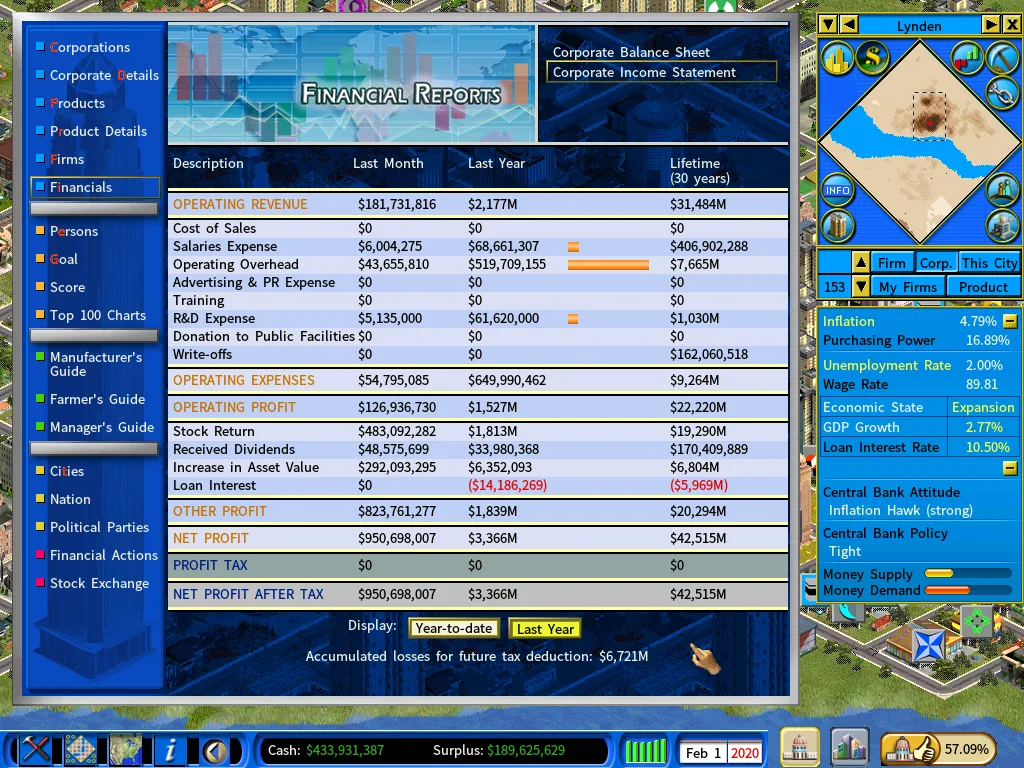
The stock Market price is nearing 17k$/share and the over-valuation is still close to the average of the nation at 1$ real asset for 1.37$ in the market.
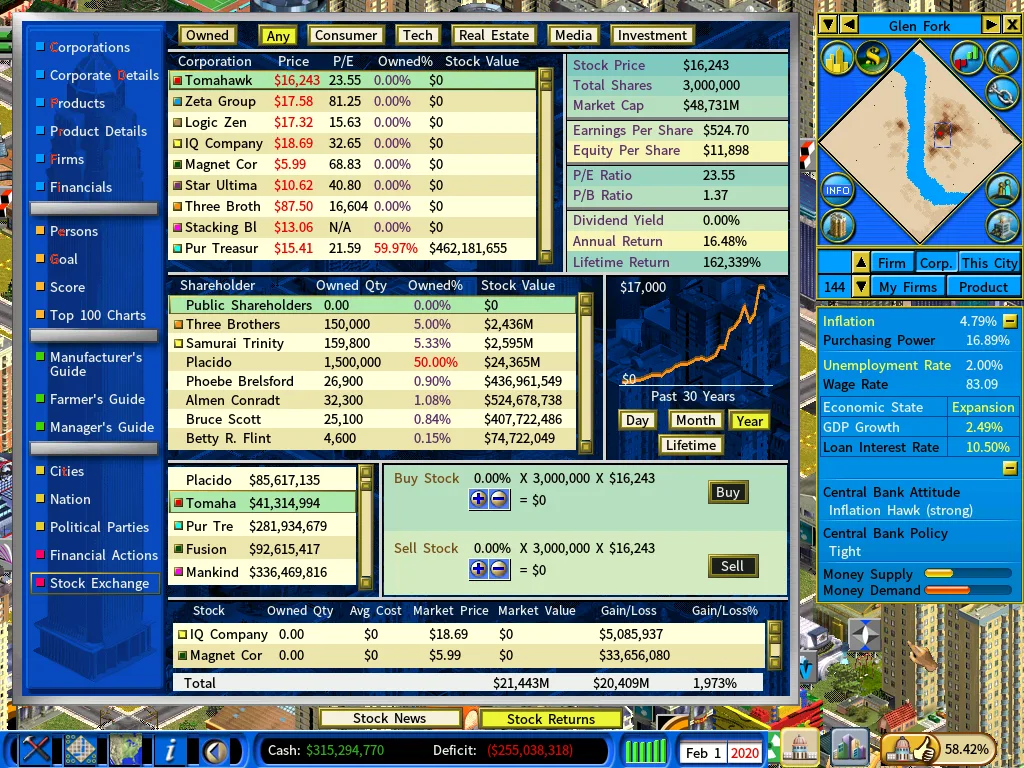
In the stock ownership menu you will see the outcome of our market-dealing with the toy corporations: We decided to sell Tricubic Space and buy Mankind.
First of all Mankind had more share % available for purchase than Tricubic.
Second, and most important, at one point Mankind decided to buy the videogame console technology from Tricubic and started producing and selling their own product.
To us that meant two things:
a) A (temporary) lower stock price for Mankind and a higher stock price for Tricubic.
b) A future market share loss and lower profit margins for Tricubic's only consumer item.
Once that was clear, we decided to make haste: Acquired 50,1% of Mankind, sold all our Tricubic claims, purchased both toy technologies from our new "subsidiary" and directed our R&D department to enhance the designs.
After a while, we decided to increase further our ownership in Mankind as much as we could, as the price was still cheap. At this moment all shares in Mankind are "private", so we ought to spend 250mm$ extra to get the ownership to 75%, in case we wanted to place them fully inside our orbit, and so be able to dictate management.
Anyway, we could always sell the stock and use the proceeds to start our own subsidiary from scratch.
Another purchase in this period has been Samurai Trinity, one of the two existing investment corporations.
Having 50,1% of their stock allows Tomahawk to purchase their portfolio at market prices (no premium asked).
If we'd aim to achieve control over the whole lot of the corporations these investment players are a key step.
We'll talk briefly about that possibility in another post.
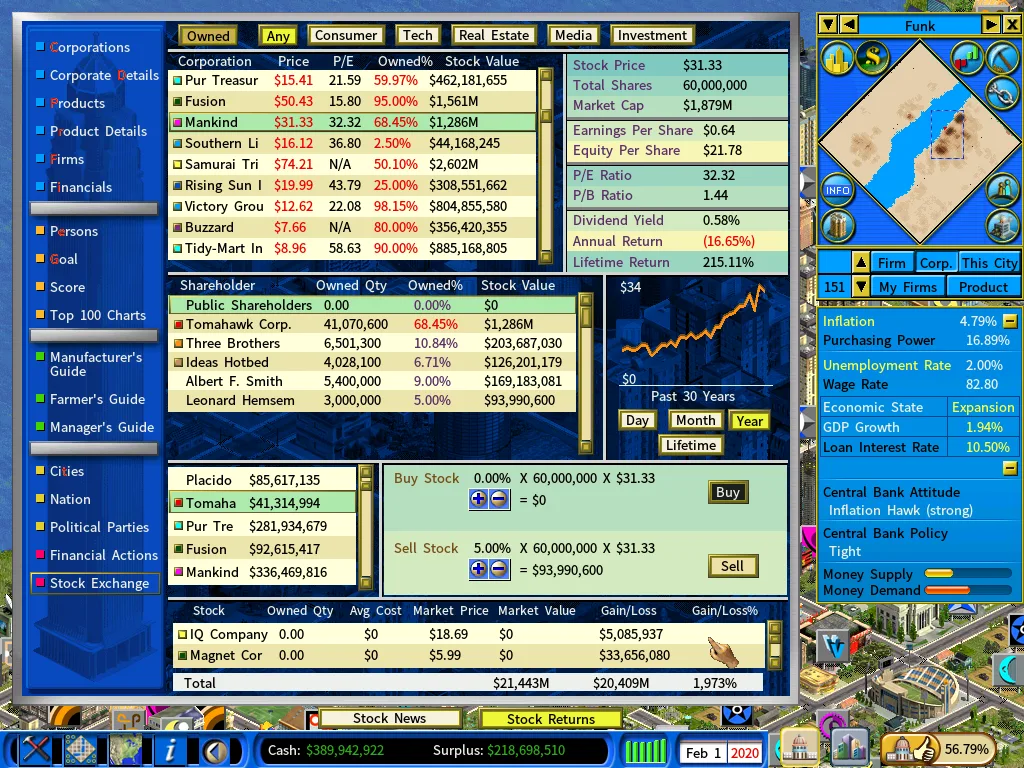
Finally, you will notice some of our subsidiaries in the menu:
As we had enough idle cash starting 2018 we decided to purchase some of their shares when cheap, with a view to sell them later if demand appears.
Tidy-Mart is finally showing a profit while Buzzard keeps losing money.
We also did an IPO for our Gazette in late 2016:
THE ADVERTISEMENT INDUSTRY:
The Sylvania's Business Gazette summary:
1-Starting with one newspaper in each city, a 2008, 10% ad market share provided us with 60-65mm$ income.
2-In 2010, as the profits had increased, we decided to expand our operations: by purchasing a cheap private TV station and building four radio stations, plus another newspaper purchased in 2011. Our aim was to gain extra market share. This expansion proved fruitless.
3-From 2010 until 2016 our Gazette still held a positive revenue. We waited to see if our manager would sell or close any of the non-performing firms, but didn't.
4-Finally, in 2016 we purchased Hyper Power's TV station in Lambs Grove for 400mm$, as we had access to capital and were hungry for yield (when money is cheap performing businesses are dear!): We had 5 year savings plus the money raised in the IPO.
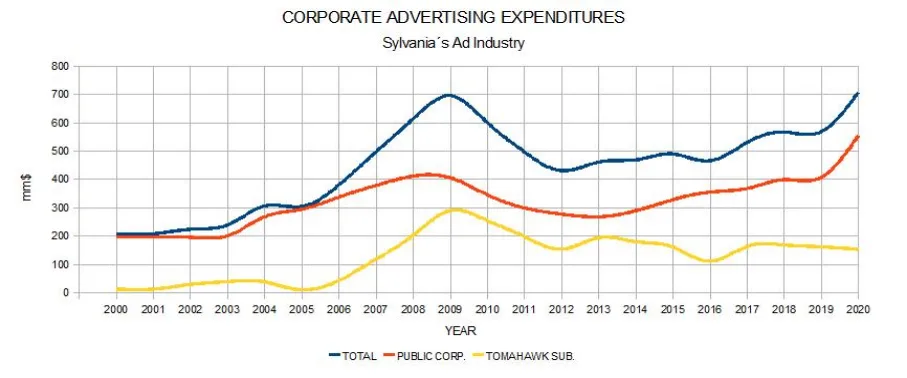
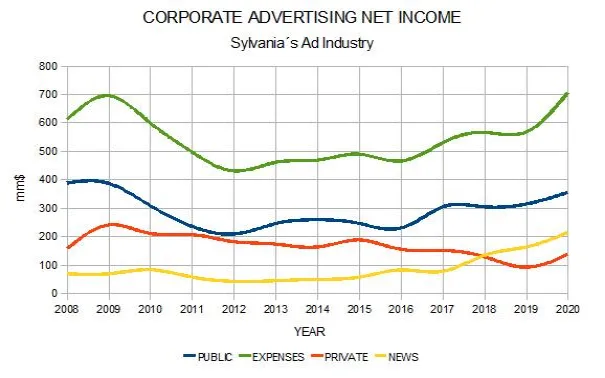
We'll show two charts to explain the evolution of the industry: one related to corporate expenditures and the other to publisher's income.
The first merely expands upon the chart that we published in our previous ad industry report.
1-We can see a steep decline in corporate ad expenditures just after our landing, as publishers kept slashing their prices because of the extra competition.
2-In 2012 and again in 2016 total expenses increased because of new corporations created.
3-Finally we have a spending binge in 2019 as we witnessed two AI mergers (their brand gets all messed up).
4-You will notice that our subsidiaries spent less than the "public" corporations: the yellow line decreases as their brand-building kind of "ends", not so with the orange line. That's because we limit the sectors where our creatures expand, so their brand tends to be cheaper and in some cases more stable.
The second shows who got the money pie. We added total expenditures (green line) to give a better perspective.
1-Blue line are city publishers, orange AI publishers and yellow our Gazette.
2-We can see how we took off in 2017 thanks to Hiper Power's TV station. That gave us our current 30% market share, with 210mm$ profits, while depriving our "competitors" (AI) from a valuable source of income.
3-Finally, city publishers command a neat 50% of the market share.
Chapter 62 — 30 November 2019
TECHNOLOGY.
Here's the updated tech chart.
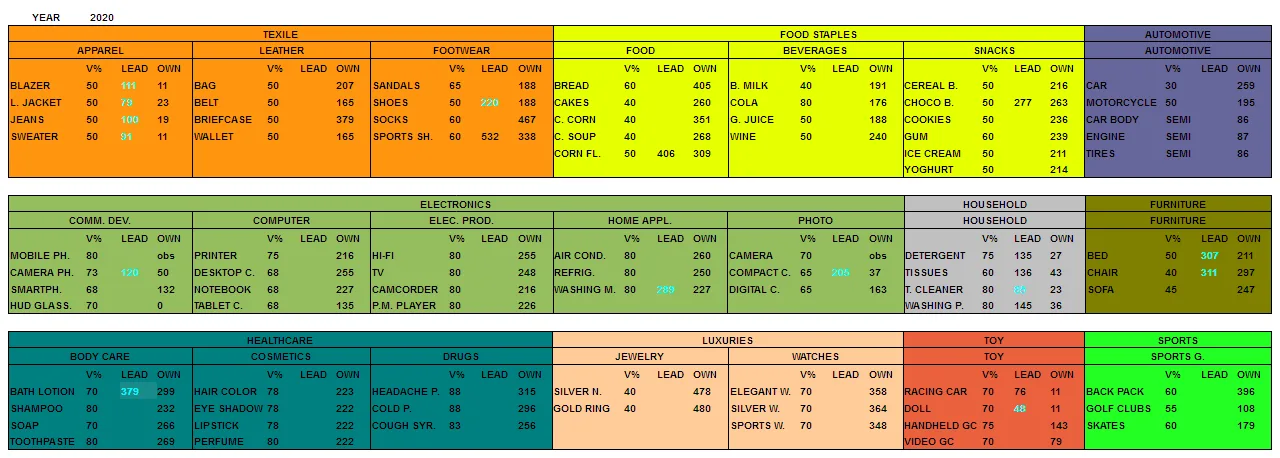
We still lack leadership in the household products category. The competitiveness rating in Lynden has been increasing for the last four years, but it didn't reach a satisfactory level until recently (and we forgot about it altogether).
A test confirmed we could bring the rating of these items 100 points up in two years with our new CTO in charge of the research projects.
Also, we still lack leadership in three miscellaneous products: sport shoes; corn flakes; toy cars.
For the rest of the consumer products, eiher us or one of our controlled corporations have the tech edge.
Finally, we decided to start accepting any tech purchase request from any corporation, and also to stop forcing our subsidiaries to acquire the latest product designs coming from our labs, for two reasons:
1-We hope this will help increase competition between producers. We'd also monitor the tech buyers in order to spot early any potential candidate to invest in the future.
2-We decided to let our CEOs evaluate the cost-reward ratio for themselves; also, to keep their books truer to their business operations, as a whole industry product tech purchase can run into their yearly revenues, and somehow blur their true profitability.
CORPORATE MARKET.
Here's a summary of the players, divided in two camps.
The ones in light blue are our public "subsidiaries" (more than 50% ownership).
Notice we regained control of Funk Apartment Holdings, as Samurai Trinity Corp. had a controlling interest there.
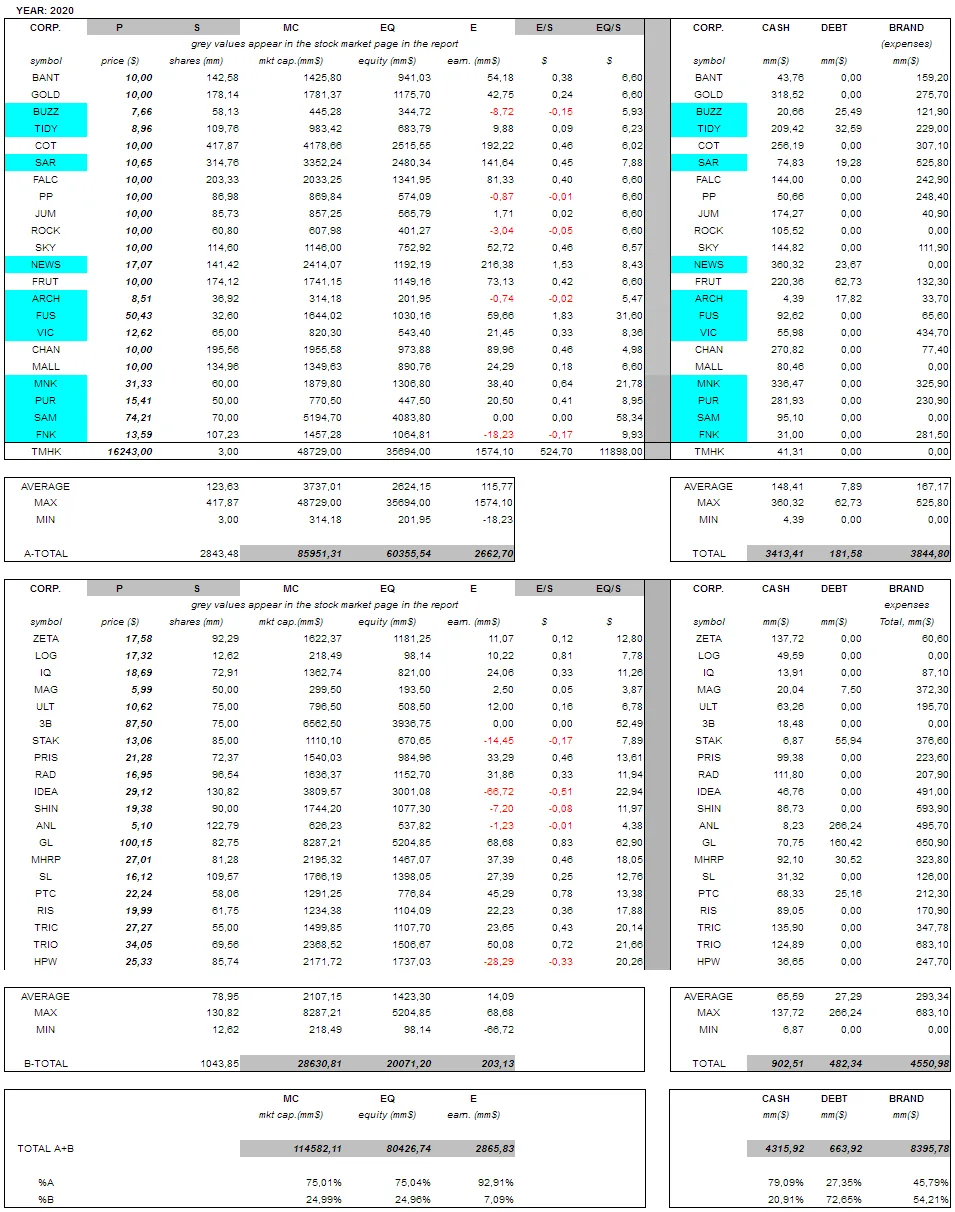
This chart not only allows us to see how our subsidiaries and "competitors" fare, but also tells us how much we control and how much is left outside our control (at the bottom). We can see that we currently control 93% of net revenues and 75% of the market cap.
The 25% market cap. ouside our control amounts to 28,6 billion$, so about 14,3 billion$ cash would be required to get these players under our sphere, and 21,5 billion$ under managerial dictate.
If we take a look at our credit facility we see we have 17billion$ available to borrow. If we'd take a 14,3 billion$ loan, at current rates, we'd have to pay 1,5 billion$/year in interest. That's a possibility, as our current income is about the same…
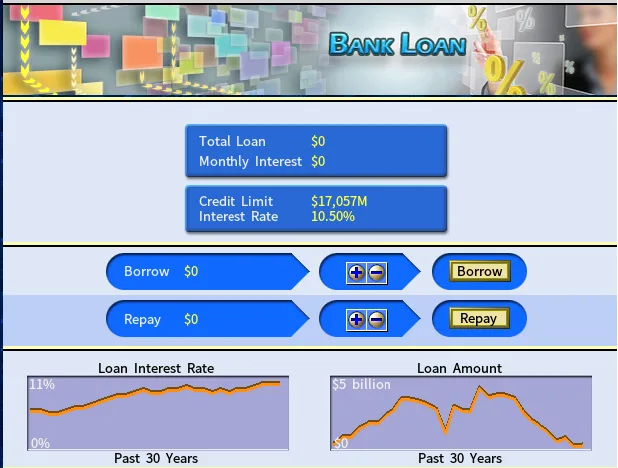
Obviously, we wouldn't borrow all at once and so the interest payments would be much smaller.
Also, we could reach out to private investors, to raise some cash through new stock issuance, or sell them part of our privately owned subsidiaries. Let's see:
In the first case we think we could raise about 500 million$/year, so it would take some time (share issuance has restrictions in the game). We'd add that to our 1,5 billion$ yearly income to make 2 billion$ cash every year for stock purchases.
In the second our subsidiaries would raise about 3,6 billion$ and we'd sell 5% of our ownership for 900 million$ (4,5 billion$ instant cash). We'd then use some of our subs. to purchase the stock of the other players.
We should add here 3,5 billion$ in cash reserves our subs. currently have, so the "purchase chest" would add up to 8 billion$ cash.
Chapter 63 — 14 December 2019
I'd like to post a few images of the cities, but I'm afraid this page's current weight is too big and it might load slowly for some users, so I'll wait until a new page is added in the post for that.
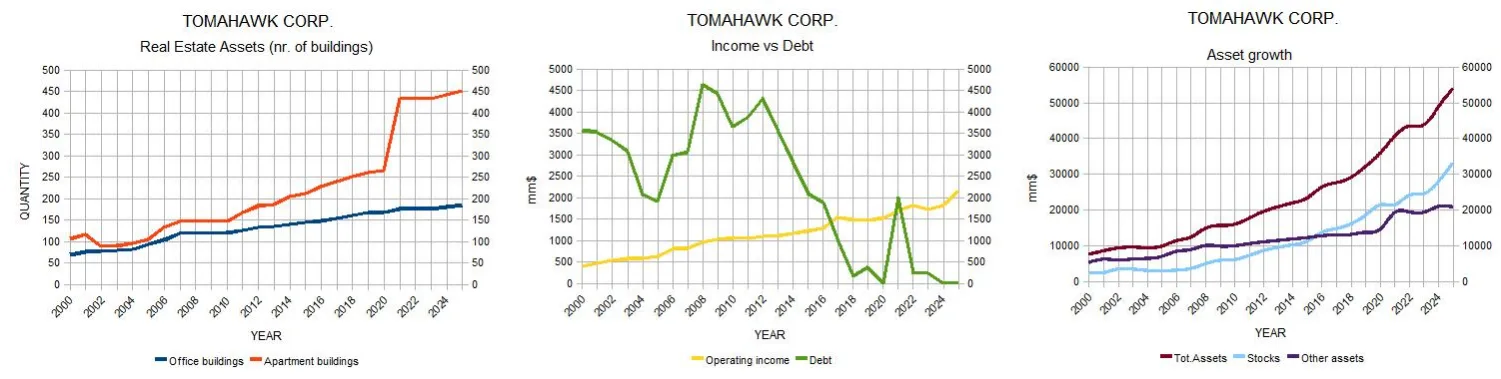
In the meantime, as a quick post, I'll publish a few small charts in two groups, about our corporation, using the data I've been gathering with open office.
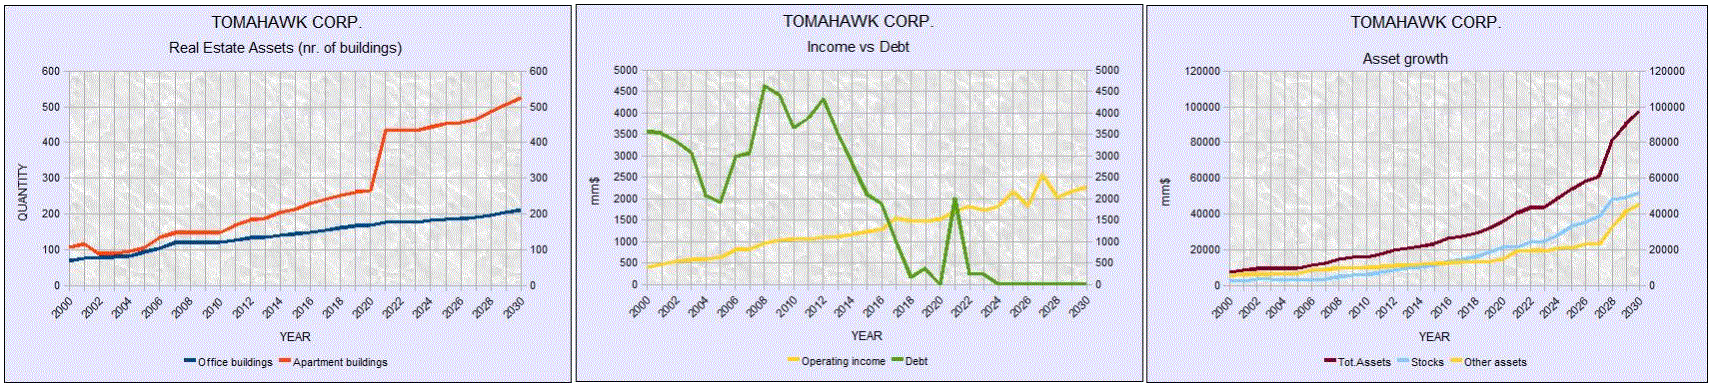
In the first group: we have number of buildings added to the nation by us, then our income vs debt and finally asset growth in two (three) categories, all since 2000.
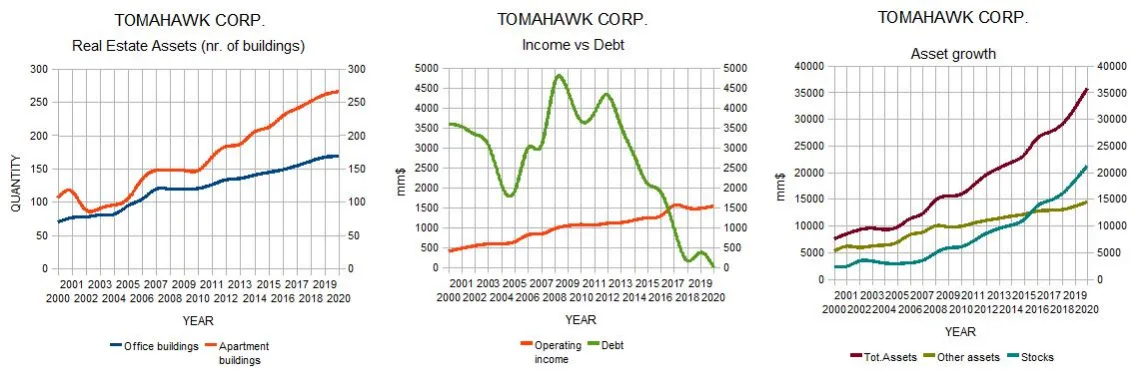
Then we decided to give it a try and evaluate the efficiency of our investing genius (ehem) through two charts.
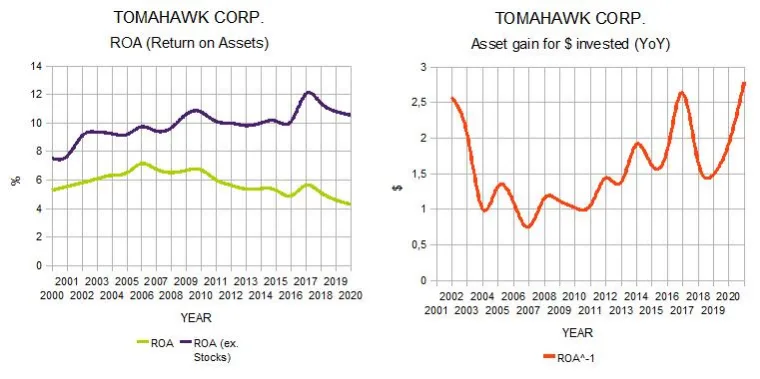
1- First we have Return on assets (ROA), meaning how much cash we got related to the value of our assets, each year.
As you might understand, stock purchases don't carry an income attached but these count as assets, so we used one line using all our assets and a second using our "income bearing land assets" (RE firms). Logically, ROE keeps falling in the first case as our income cannot keep pace with our stock purchases.
2- A better approach in our opinion would be to know how well we have invested our income, or how much bang for the buck we have been getting.
For this we just flipped the ROA formula upside down, and considered (asset increase – debt increase) / last year's income.
Then we can see how many dollars of asset increase were achieved this year against just one dollar of last year's income (should we say $ylvanor?).
And forgive me in advance if I missed something in this back of the envelope approach.
We can see that in 2006 we did some bad investments that paid just 0,75 cents for each dollar in 2007;
Around that period we barely managed to protect our corporation against inflation, getting one-to-one$;
In recent years the investment in stocks has been paying a nice "dividend" indeed (in 2020 we get 2,79$ for each dollar invested in 2019).
Finally, the chart shows the year record a bit misplaced to the left.
Now to the averages (2000-2020):
Average offices built per year: 4,95
Average apartments built per year: 9,89
Average income growth: 7,3%
Average assets growth: 8,25%
Average pop. growth: 160k nationwide.
Average ROA (ex. stocks): 9,97%
Average ROA^-1: 1,59$
Thanks for reading.
Chapter 64 — 15 February 2020
CITIES
Our political party won the elections in every city, so we'll keep managing the city budgets.
To that purpose we upgraded the ledger that we provided in our 2016 report, to project our plans for the country into the future.
We had two choices going forward: expand the budgets or contract them. We decided to go with the latter by lowering taxes, cutting services and privatizing assets. Here are our thoughts about the matter.
1- EXPAND THE BUDGET.
We could raise taxes to 20-25-30 for this period and maybe become tax addicted in the future as we keep expanding govt. spending from one year to the next.
By doing so we believe we might begin tightening the economy: by lowering discretionary consumption, by discouraging private investment and by depriving the small guy of their means to save and "invest".
That trend of higher taxation could mean a higher but unsustainable standard of living in the long term (higher govt. spending); lower overall corporate profits resulting in lower market valuations; higher unemployment (except for the government sector) and a lower inflation rate. We could end up tanking the economy.
If our aim would be to become the dominant corporation then this path would serve our purpose: lower stock valuations and a lower inflation "tax" on our future cash hoard to acquire our "competitors", we'd be paving the way to the formation of an unproductive, but profitable, cartel. Our shareholders would be pleased.
On the other hand that trend could be averted by using the tax money by building both extra infrastructures (transportation; communications; and a long etc) and a higher level of education for our citizens (human infrastructure?).
Both aspects would boost the productivity of the nation: lowering costs and prices and making our products more alluring, at home and abroad; encouraging the creation of new businesses and in the process both raising salaries and creating high paying jobs; and so expanding the tax pie as we move along.
Obviously there is no slider for infrastructure spending nor any way to measure or affect productivity except by the competitiveness ratings by product category, and these are achieved by just a small, well invested sum each year in university research. Neither we have seen health care levels to affect productivity, nor the rule of law through municipal couthouses nor the emergency services to provide any benefit therein; etc. So we decided for:
2- CONTRACT THE BUDGET.
We will aim at:
16%-18% income tax to have the jobs&income category at 100. By taxing less we don't think the game will recognize any special benefit. That's our anchor.
20% VAT to discourage discretionary consumption and incentivize savings and "investment" by the small guy (be it in new ventures by starting their own, or existing ones by becoming shareholders?).
20% corporate tax, as the game considers that level "neutral" and because the budgets would become too stretched by lowering it further.
With this level of taxation we must cut some more to balance the budgets, so we'll get rid of all unemployment benefits (anyway, we have in theory full employment across the nation at 2%, and are paying almost 1 billion$ every year on that!)
Also we will start selling apartment blocks to Tomahawk Corp. to raise some cash in Funk and Lynden, this time. We'll use that money to increase the number of education facilities there as we deem appropiate.
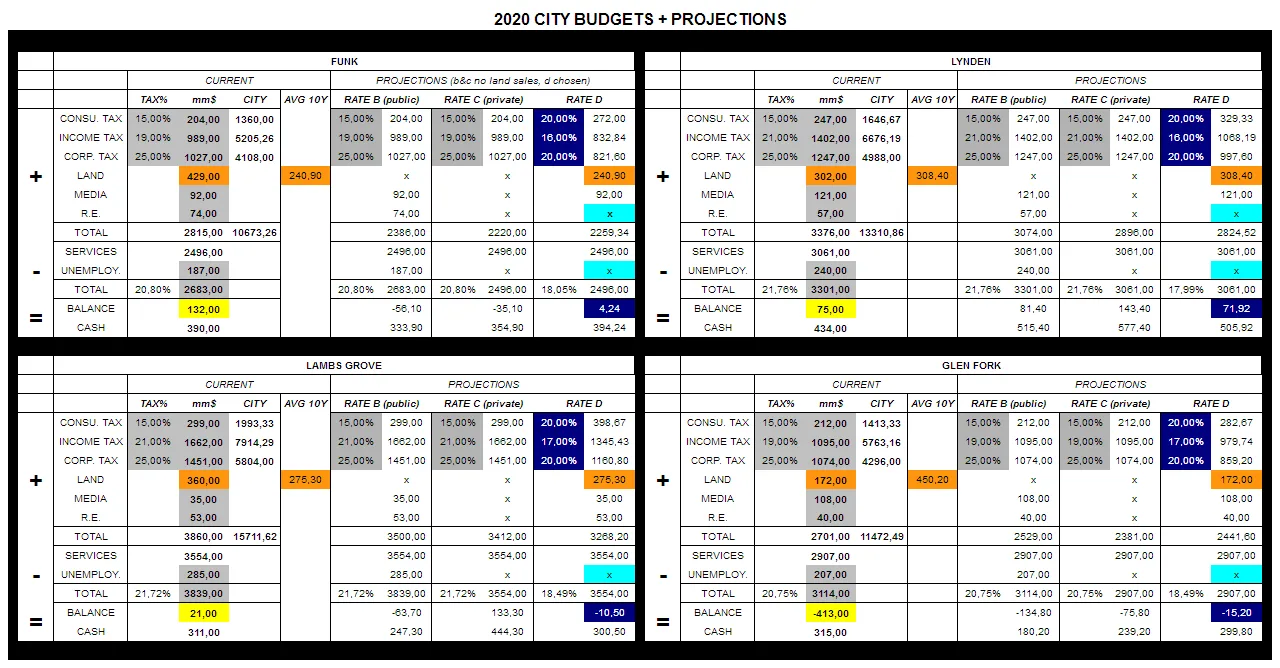
As you can see in the ledger we have CURRENT tax levels, RATE B ("expand the budget"), RATE C ("contract the budget") and a new rate D (our choice). We kept the tax rates in B&C unchanged but substracted there land sales to see if the tax level was sufficient for equilibrium without the income from the land sales.
Added current cash levels.
Added a 10-year-average of past land sales in rate D as a more reasonable level to measure future cash flows than current land sales (in Glen Fork we opted for current land sales as the 10-Y-average was too high).
The light blue indicates where we cut spending or plan to privatize. Grey means inputs in the excel, and dark blue the most relevant data.
As you can see all cities have cash reserves to withstand 4-5 years of "projected" deficits (when it applies).
Chapter 65 — 15 February 2020
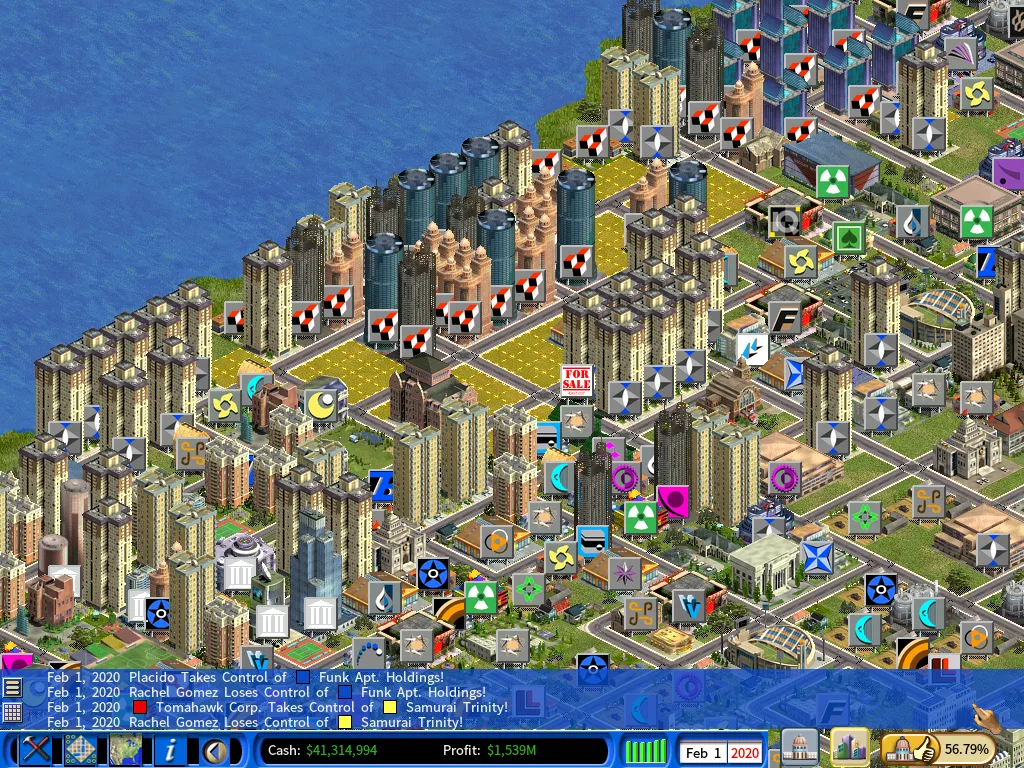
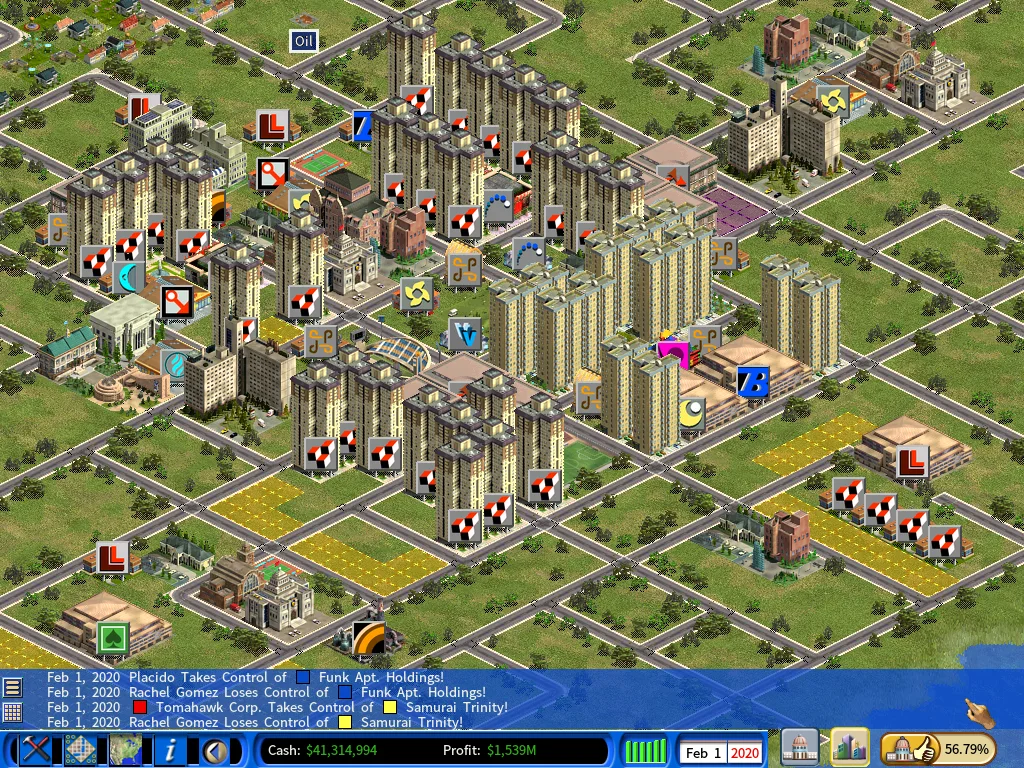
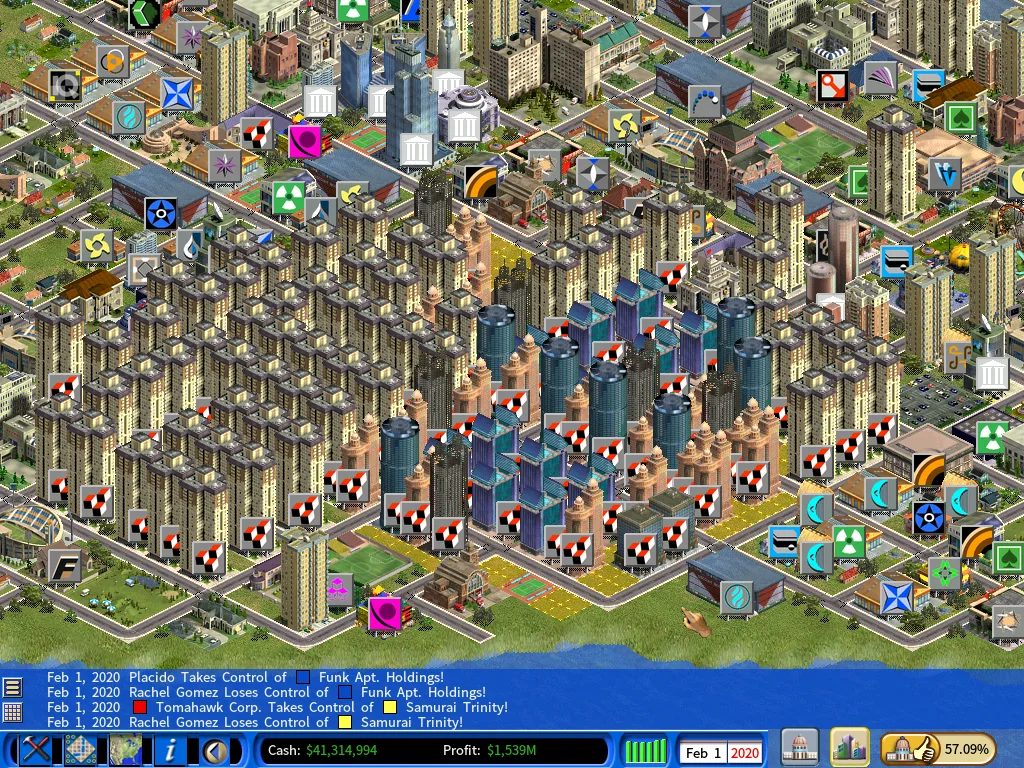
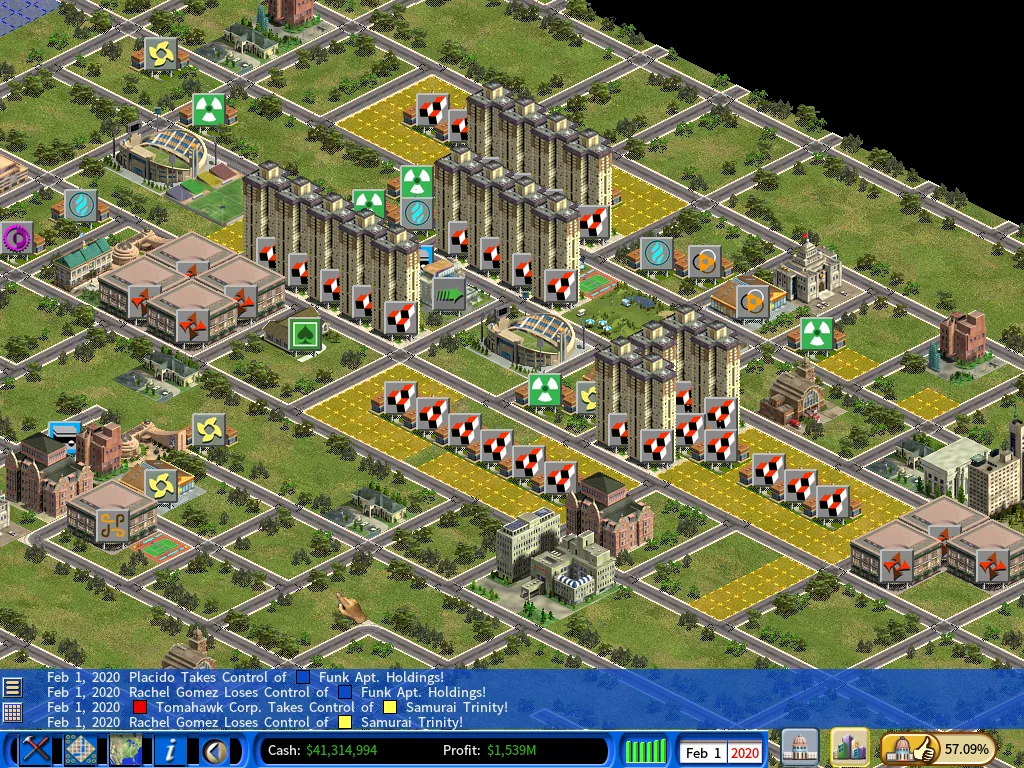
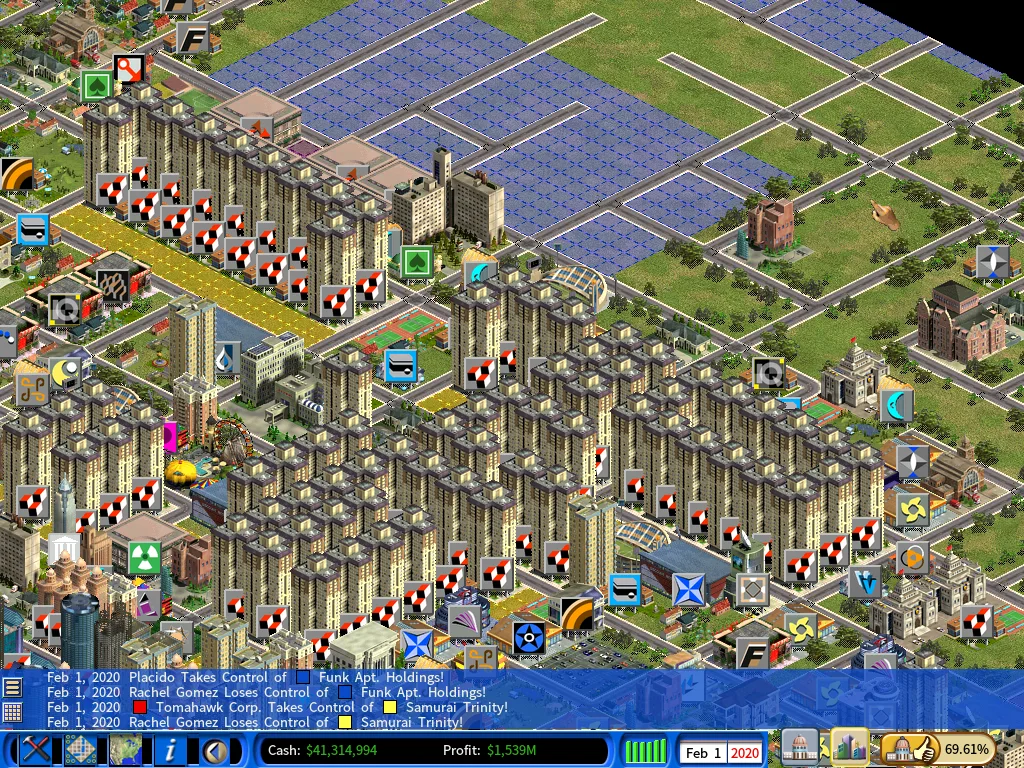
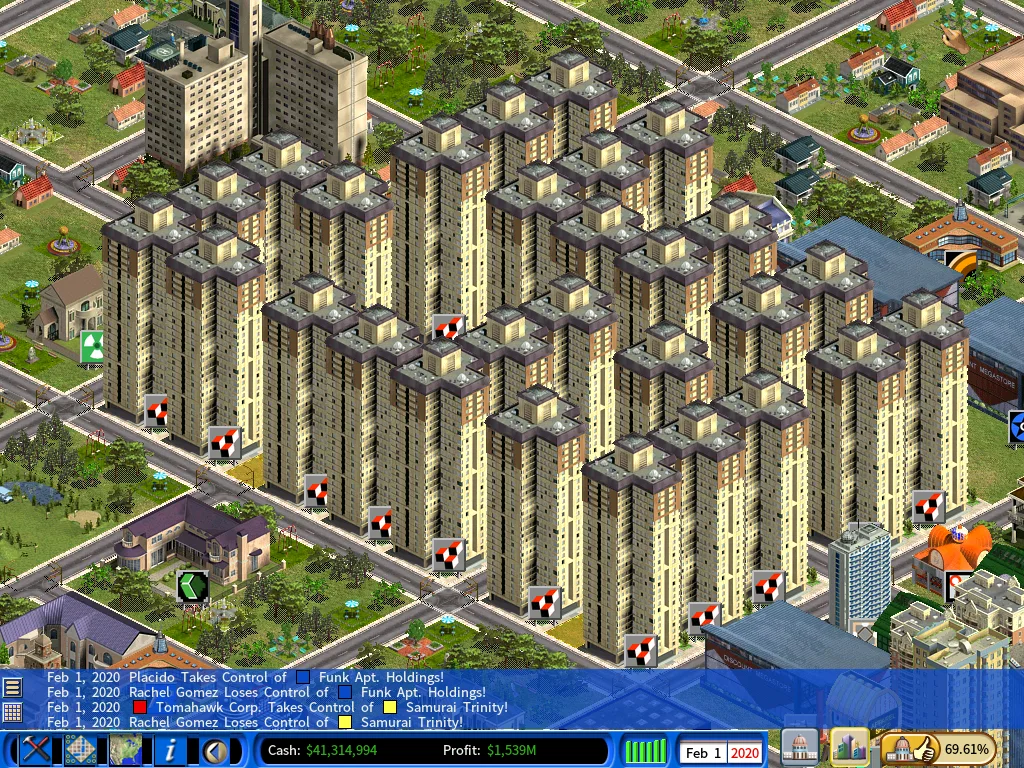
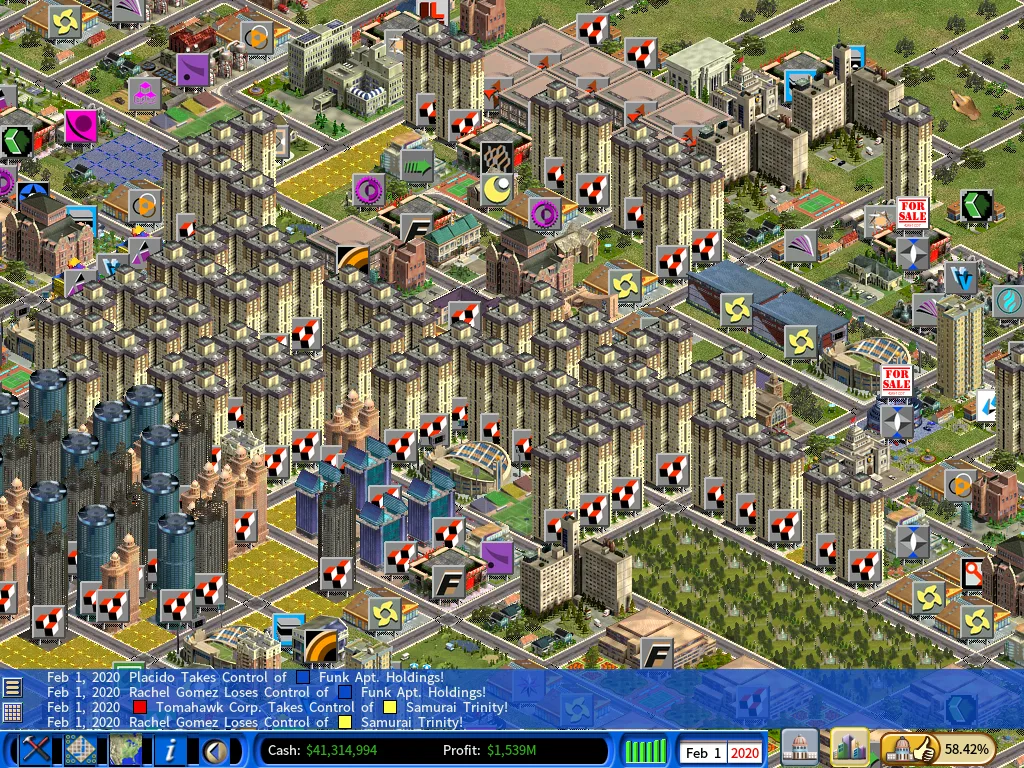
CITY VIEWS.
Presented without comment.
Chapter 66 — 8 April 2020
Hello again!
As I've been sick for the past month I haven't been able to post what was promised, so give me a few days to get back to the scenario… I hope I'll find some strenght soon, but don't push too hard
But before that I'd like to put the game I've been playing in perspective to present times, as was my intention somewhere down the line, as now in 2020 a few pieces of which I'm aware are starting (once again) to fall into place in the global arena.
As you, dear readers, might know by now, as you have reached so far, and congratulations by the way, we have been playing of late the role of a kind of supra-entity incarnated in a big corporation, Tomahawk Corp, that has been both backed by big assets (real estate) and funded by Sylvania's commercial bank.
Our aim has been to improve Sylvania's economy, by means of monetizing our assets, to set up successful new ventures. We have tried to hire the best talents available, our captains of industry, to manage these in order to create jobs through competition with the previous industrial establishment, and prevent any poisonous monopolies, which are good for profits, bad for the economy. If any monopolies will arise (by our own hand) in the future, these will happen to be short-lived as we'll just aim to re-structure failing businesses.
Our interest lay in a strong economy. We will use a crisis to buy assets on the cheap, right?
We have been using the commercial bank to strenghten the economy: We monetize our R.E. and hand the cash to real producers, in all effects turning ourselves into a financial player…
———–
Now, take a look at where money comes from (in the real world) in this video. It makes reference to Richard Werner's work (that sharp and articulate German gentleman) and I encourage you select few to follow through at your own discretion.
As how can people live all around in such darkness before such an important matter boggles my mind.
So for you, select few, who own the spark of the divine in your soul… here's a well deserved message.
Ok, assuming you already watched the stuff, so what happened in 2008? The "too big to fail" banks wanted government money and they threatened catastrophe to all in case it wasn't handed out. Will you lend to productive business as it's your "mandate"? govt. asked (as they have money minting "monetization" privileges, they are not so private after all, are they?)
Absolutely, they replied. And then they "parked" it (new financial "tool") at the "Federal" "Reserve" to get free interest on it, instead. Free money, it does exist it seems.
The result: destruction of productive businesses, the pillar of our material existence.
Now, in 2019-2020 the armageddon card, remember, was spent in 2008. They are in trouble back again so what could they possibly do?
Well, create havoc so the pain "down here" is real, this time? I wonder.
So, with the cash flowing in, as it's already happening, will they jump-start the economy this time? Before buying assets on the cheap? After? At all?
Before a revolution takes away their powers of monetization (once again), turning it back (once again) to We, the People?
I hope you find these questions as interesting as I do. I have no answer. Feel free to add your own thoughts, but I think we are watching an old story unfold (once again).
So long!
Chapter 67 — 28 April 2020
The board has finally decided for these measures to be carried forward within the next 2-3 years:
1- Use the Gazette to purchase the government media in Lambs Grove, both the radio station and the newspaper, for 350 mm$ total, using cash reserves.
They have low incomes and are low priced, comparatively speaking. We'll help the city budget that way so Tomahawk can buy back its previous land purchase "subsidies" there.
There will be two private media firms left operating in that city after the acquisitions, with a very small market share both.
2- We'll finally purchase ALL government apartments in all cities for 3 billion$, using our revolving credit facility. The cost is estimated at 147 apartments at 20mm$ each average. Their income generated yearly can be seen in the 2020 city budget chart provided before, around 225mm$. Interest payments will be 180mm$ so we'll still be making a profit. Cities will use the cash to set up new education facilities (esp. new high schools and universities) with the hope that the industrial productivity will increase in the future.
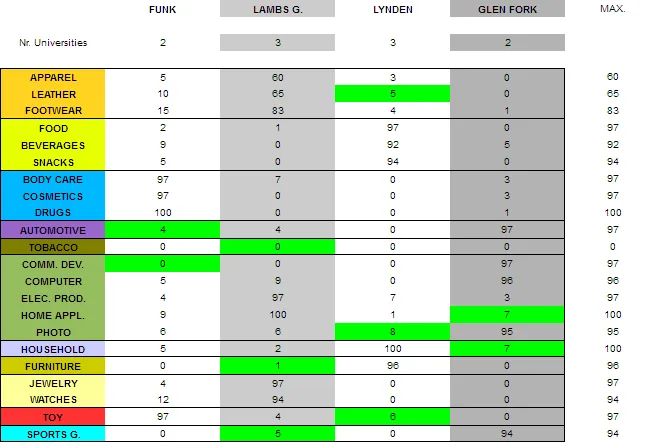
3- We have updated the Industry competitiveness chart to see where we'll focus the public research budgets. All product categories are covered in one city or another, but we need to spend, and we believe this is a good way to do so. We marked green the areas to cover in the next years.
4- We'll keep building new offices and apartments if demand for these increase, as we believe will be the case.
Remember we aim at just shuffling ownership with our acquisitions so we won't be creating any economic benefits. We'll delegate that role to the cities, this time, as we think the amount of cash provided will do for the time being.
4- We'll use Tomahawk's income of 1,5 billion$/year to reduce the principal of the 3 billion$ from the credit facility, each month and we'll keep an eye on the stock market for cheap purchases. That will require between 2-3 years. After that we'll pause and evaluate the situation again, without reporting back to you.
We'll also monitor the evolution of our new budget policies in all cities and see the impact these will have in terms of GDP and overall economic activity, together with the state of the consumer industries yearly, both in terms of corporate market share and profits, and new technologies implemented.
Finally, we'll report back to you in 2025 after the mayoral elections end.
Chapter 68 — 9 May 2020
FEB 2020 – FEB 2025
Since 2020 inflation has remained quite stable at around 4,5%.
We started this period by "monetizing" 2 billion$ of our assets to purchase all government apartments at once, and we spent the first 2-3 years of our income to return our liabilities back to zero.
We also looked for opportunities in the public marketplace and bought shares in some of our "competitor's" stock.
After that we followed our plan of creating new business ventures by investing 3 billion$ of our income in 6 new corporations, plus we built new apartments and office buildings after demand started growing (again)…
As the 6 new ventures are still in their infancy we will not report about them this time.
————
We have grown our balance sheet by 50% and our operating income by 40% since 2020.
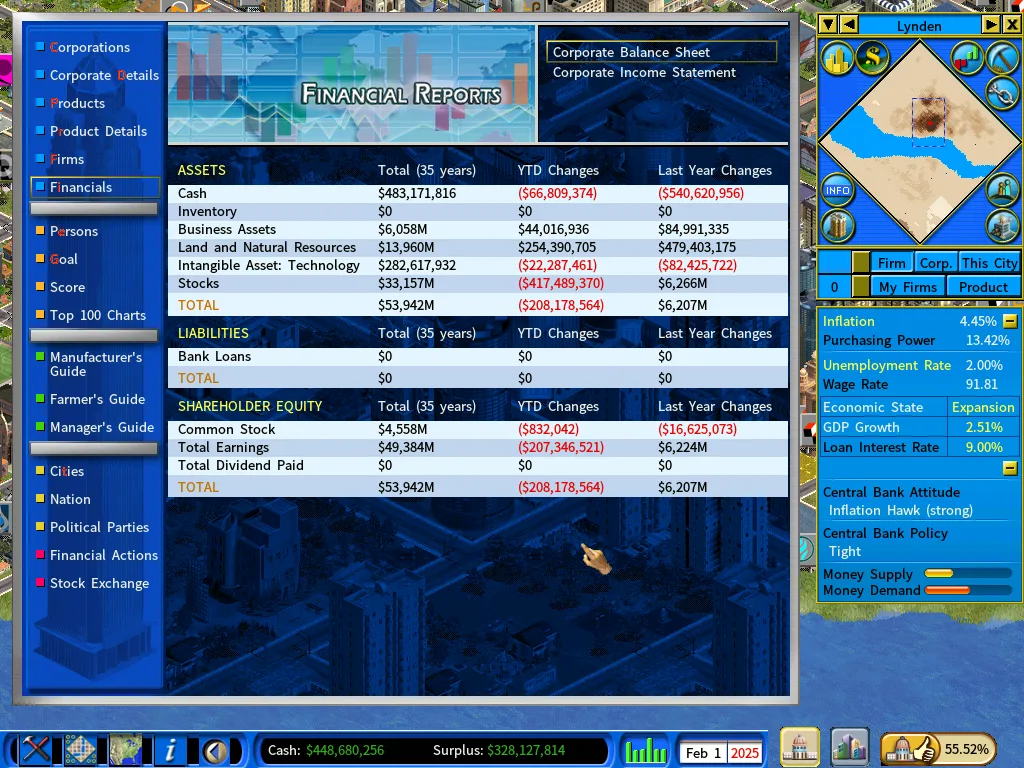
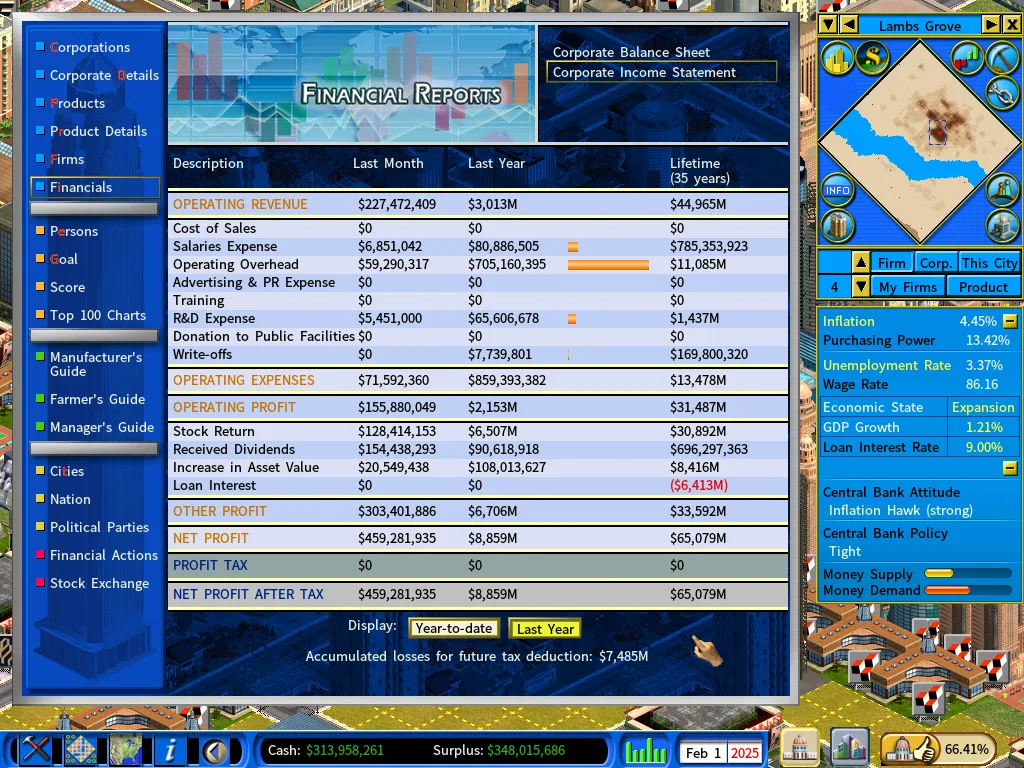
Tomahawk's stock price has remained flat despite the above, so we are guessing it will soon play catch-up.
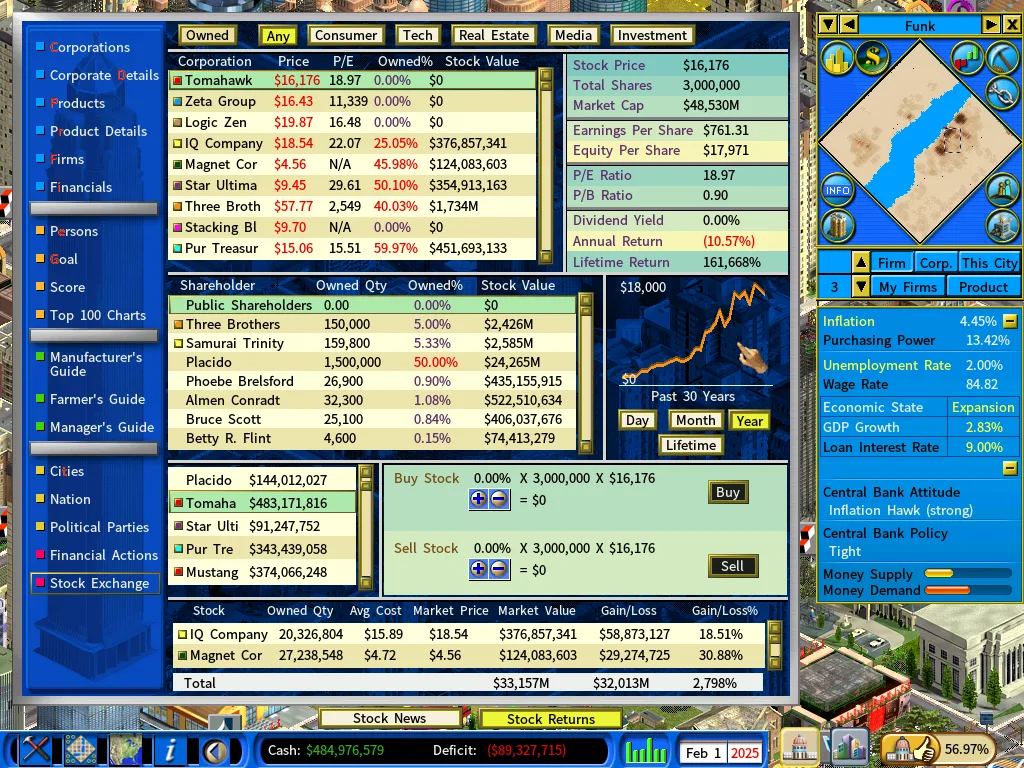
Here we can see a few of our acquisitions:
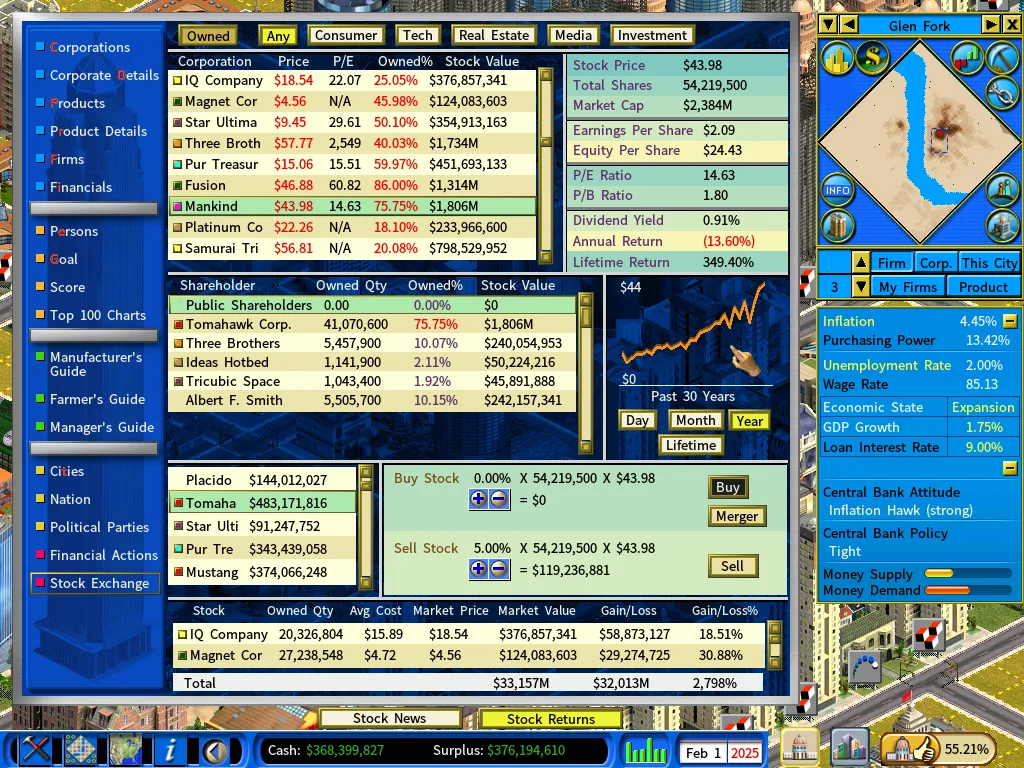
Mankind, the toy manufacturer, started repurchasing its own stock so we grew our ownership to 75% without intervention. As we expected form our previous analysis of the toy market, the price moved up quite a bit (almost 50%) reflecting the projected increase in sales.
We can also see we shuffled our ownership between the investment corporations (3B and Samurai). We hold a substantial amount of cash in both stocks (2,5 billion$). As both have a 5% ownership in Tomahawk we are indirectly speculating in the future of our own corporation, so we plan to increase our ownership further right away, as our stock looks rather undervalued at this moment.
We have also acquired two beverage companies whose stock was priced below book but with positive cash flows (RIS, ULT).
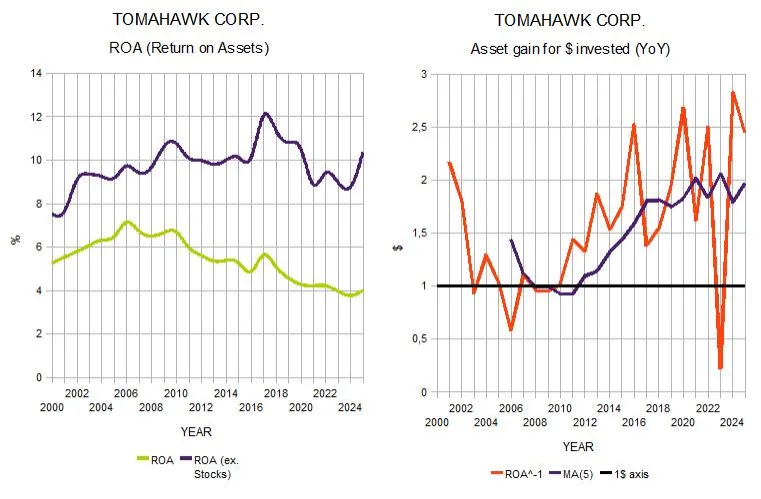
We have also updated Tomahawk's charts provided in 2020.
We have updated our Stock Market Tryptich to (try to) make it look sharper. We have also included a few extra metrics that we thought would be useful to better understand both the evolution of the corporate sector, and its current state overall. I'll provide a few comments about that next time.
Included in the chart are: PAST period, CHANGE between periods, revenues(!), and OTHER metrics (ad expenses, share issuance-repurchase, etc).
The image is large so I don't know how it will look here. Testing.
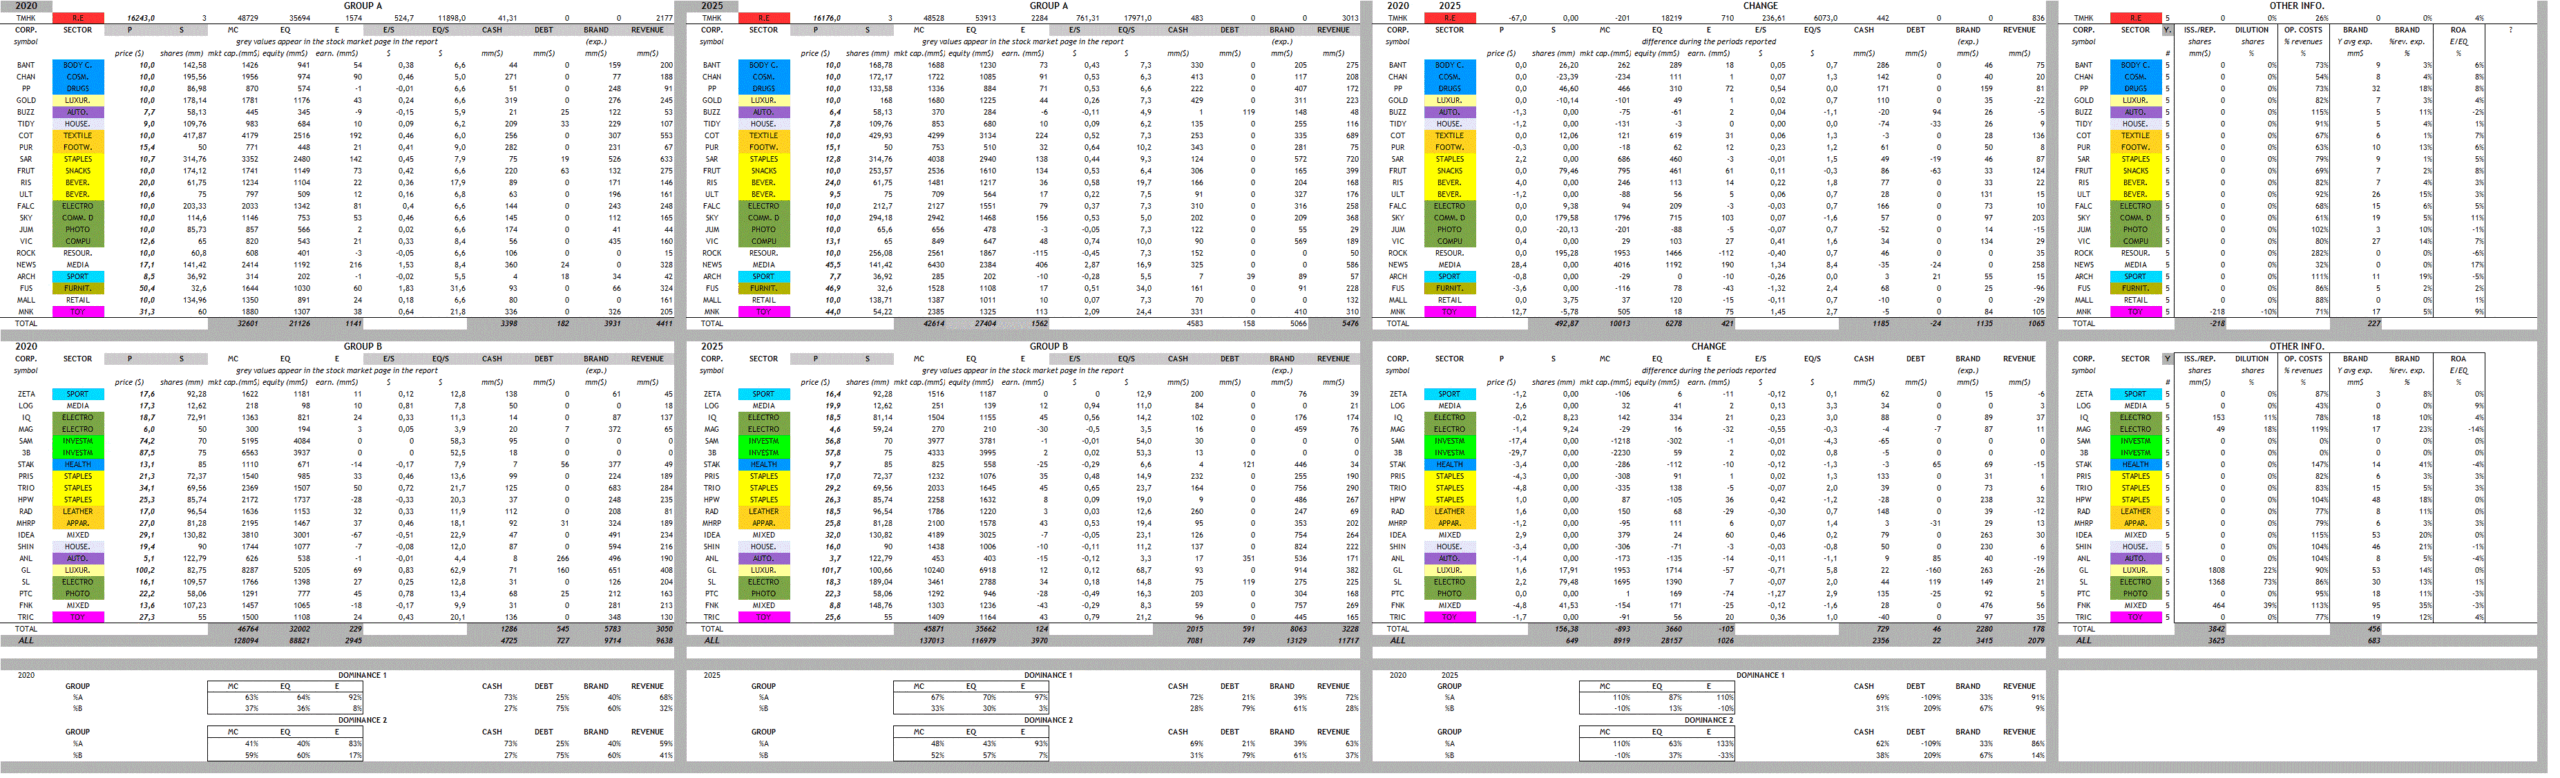
As you can see we have also included a "business sector" cell to each player, and joined corporations in groups, to be able to add a "business sector comparison" chart in another report, easily, taking advantadge of the gathering of all the data. This way we'll have an easy-to-compile, easy-to-read "report" to try forecast trends.
I.E:

Finally, I provide the excel file in case any of you want to check it, add, substract or better it in any way you please.
In case you do, let me know so I can use that too.
Chapter 69 — 11 May 2020
Hello David. The data compiled is the most relevant that I find for corporations and to study their progress at present. It would be good to have more groups of data, like one for the consumer market and another for the cities, at least. I haven't yet explored the digital age dlc nor the banking dlc, but I'm sure these will require new extra fields.
Maybe you noticed but I constantly add stuff here and there as it comes to mind: it's an open process and probably some more ideas will pop up in the future. It'd be good to know the opinion of the community.
Chapter 70 — 11 May 2020
CORPORATE ENVIRONMENT.
So, let's provide a few observations about Sylvania's corporate environment:
Dominance 2, (excluding Tomahawk Corp.) shows a few statistics comparing the group controlled by us (A) vs the group not under our control (B):
To give an idea about SALES EFFICIENCY, we can see that our A "team" generates 93% of total corporate profits, controlling just 47% of the total equity.
Related to efficiency, we have included operating costs (as a % of revenues) in the far right for each corporation. Any number above 100% means the corporation cannot cover their operating costs with their income (a.k.a is losing money).
If we look for sectors with the lower costs to operate, we see both R.E. and Media at the top of the list. In this case we assume that's so because they have virtually no competition, so they can charge a higher price for their services and have not any second thoughts about it.
Other business sectors are all above the 50% threshold, being our cosmetics subsidiary(!) (CHAN) the most efficient, making almost 2$ for each 1$ "invested" (53%), followed by SKY (61%).
That could mean a monopoly, even if disguised, is in place.
In terms of MARKET SHARE, we could look at revenues (gross earnings) to see where the chips are falling: it's A 63% vs B 37%.
Altough local producers still control a good chunk of the consumer market, we can conclude that our team is doing quite well in terms of GROWTH. Looking at gross numbers, we increased revenues by 1 billion$ between 2020-2025 while our opponents did by a mere 180mm$, or a 5:1 or better growth ratio between them.
Looking closer we can see that most of our growth came from both our newspaper publisher and our smartphones subsidiary (SKY).
By looking at this data segments we could argue to make a case for future new ventures: high efficiency and high growth possibly means a new frontier is being opened, so we could always drive a wedge there if we move fast and can find a good and motivated manager.
Next, we included a % of revenues spent in marketing, for each corporation.
We can see that many use less than 6% of their gross income to, we guess, MAINTAIN their brand level. These would be corporations with a mature brand that are not suffering from new upgrades to their line of consumer products nor from careless diversification.
Any number above 6%, we're guessing, speaks volumes about corporations finding obstacles pushing their products to market.
In extreme cases the expenses can go quite high (FNK 35%, STAK 41%) and we assume these players are diversifying their product lines with the wrong marketing strategy (forced mergers & corporate strategy?). We believe the only solution there would be to reset brand or risk bankrupcy.
In any case we detect a few corporations whose marketing expenses are currently low in terms of revenues (below 6%) and also have been low in absolute terms (CHAN, FRUT, FUS), probably meaning lack of appeal in products of the competition, both from other corporate players and also locally produced. Again that could give us clues about "new frontiers" for new ventures.
Another aspect included is share issuance/repurchase:
We mentioned before about our now fully incorporated subsidiary MNK (toy) repurchasing their own shares (using 218mm$ cash).
On the other side of the bridge we find that there has been a lot of reaching out to private investors for funds: two blatant examples that raised 3,2 billion$ that way are GL and SL.
As the result has been a mere increase in equity and not in earnings nor revenues, we guess they used the cash to set up resource firms. Lucky us, we haven't had a sizable interest in any of them… so far.
CITIES.
Here first, as stated before, we sold all govt. apartment buildings to Tomahawk, and then a few public media companies to our newspaper, all at reasonable prices. By the way, we noticed (now) that these media firms sold were paid in full, but only 1/3 of the cash found its way to the city coffers…
With the cash we built a few new schools and other education facilities.
Then we lowered the tax rates as planned and set the unemployment benefits to zero.
Well, that last backfired and proved to be horrible for our R.E. business, as many people emigrated.
We were then forced to reverse policy two years later and allocated a 40% benefit as the minimum required to prevent the drain.
Cities now have to spend an extra billion$ more each year than previously planned, half of it in Lambs Grove because of growing levels of unemployment.
That, plus the (over)expansion in education facilities forced us to gradually raise income taxes to 22%, thwarting our previous plans for a high income&jobs rating.
BUDGETS then remained quite stretched for the most part of 2020-2025: As we didn't want to deviate too far from our original intention, taxes were set to break even. As that didn't prove to be enough we were finally forced to issue one 200mm$ bond in most cities, plus Tomahawk had to intervene by buying land.
UNEMPLOYMENT: has remained stable at the minimum 2% in all cities except in Lambs Grove, the biggest, and once richest, city, where unemployment reached at one point 4,5%.
At that time we thought a good temporary solution would be to try to put a lid on the opening of new factories in Funk (the "industrial" city) and also stave off there a runaway budget, by raising corporate taxes to 25% and so divert some factories to Lambs Grove.
In 2025 unemployment in Lambs Grove, we believe, has changed trend and now stands at around 3,5% but we cannot make sure yet that our new tax policy in Funk was the cause or even if unemployment will keep rising from now on.
PLANS: Our objective is to have a 100 level in income&jobs. When that category improves, as people get higher salaries and are fully employed, we could raise income taxes further keeping the 100 level. We assume 100 means people have enough income to buy all the stuff they care for, and can put aside some cash for a rainy day.
We believe we are doing a good job on the corporate side, but probably we could help local businesses to create some extra high paid jobs: We knew all along about the GLOBAL competitiveness rating, but we haven't been paying too much attention to it, so we have updated the city competitiveness chart to reflect global levels so we can direct our universities to fill the gaps as follows:
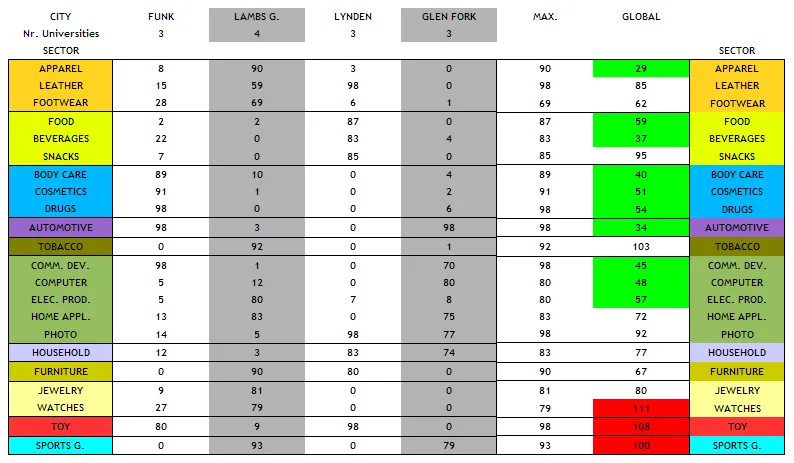
We'll increase research in the categories below 60 and stop research in those with higher levels of global competition (esp. above 100).
We'll make Lambs Grove invest in the lower end of the range and see if locals can offer the needed jobs.
That way the city budget will become less strained. In the meantime we'll have to raise both income taxes (25%) and corporate taxes (23%) there, as shown in the chart:
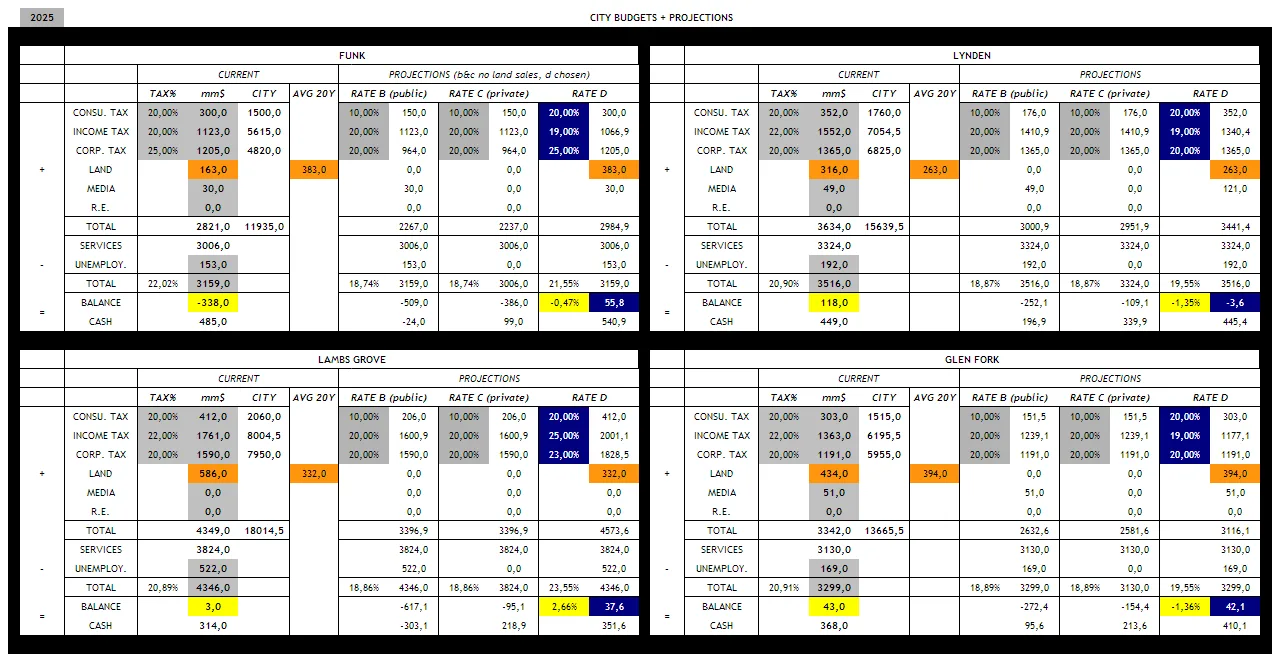
We have changed the average of land sales to include the last 20 years of data so it becomes more reliable.
We'll lower taxes in both Lynden and Glen Fork and will keep the 25% corporate tax in Funk.
NATION:
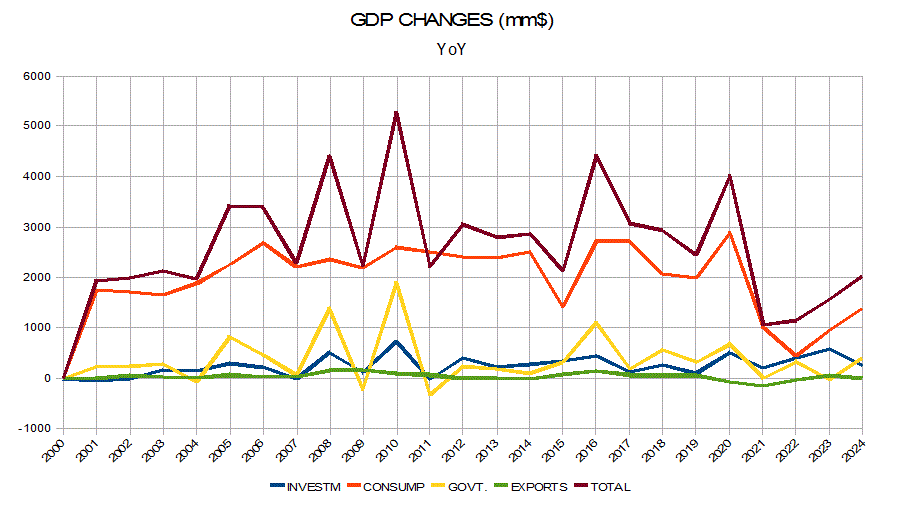
We'll now offer two charts about Sylvania's GDP component evolution before we start playing the next period, with some brief comments:
As you can see there's been a big drop in the growth of consumer spending thanks to our unemployment benefit policy of no-benefits.
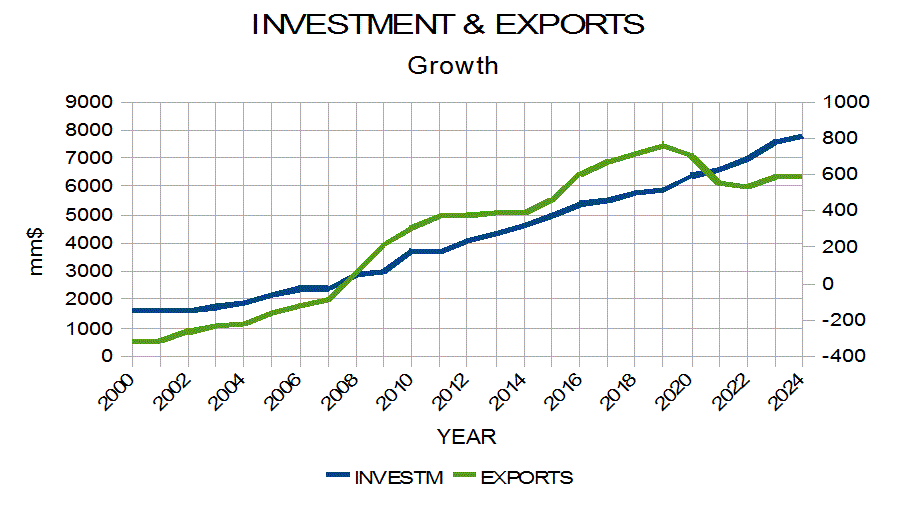
In the next chart you can see that private investment has kept increasing side by side a decrease in the number of exports, meaning a deterioration in the quality or appeal of the Sylvania brand abroad. We hope our new university research focus will revert that in the immediate future and we'll see exports picking up again.
Chapter 71 — 17 June 2020
FEBRUARY 2025 – FEBRUARY 2030
Two features of this period have been:
1- Since 2020 we created 12 new ventures, and started selling parts, or in some cases all, of our old ones.
2- In 2027 we built a new city: Oakland.
(#12) NEW VENTURES:
1- The set up cost has been 6 billion$.
2- Have combined yearly revenues of 600mm$ and earnings of -270mm$ at present.
3- Our plan is to use them to COMPETE with the rest of corporations for the reasons we have been talking about in previous posts. We'll introduce them briefly in a future post.
(#18) OLD VENTURES (included Funk Apt. Holdings):
1- We IPOed all of them except Rock Smelters Ltd.
2- We sold our entire stock in some (the worst performers).
3- We sold part of our claims in others, to the point of losing control over some of them.
4- We purchased the issued stock in the best performers, after the IPO.
We know there are three ways to increase the overall liquidity in the game:
One of them is to do an IPO of a private corporation, drawing in the invisible public shareholder.
Another is, apart from increasing the consumer base, increase the appeal and price of the consumer products.
The third is to draw in the invisible creditor.
NEW CITY:
1- In 2027 we had so much capital at our disposal from the sales of stock that we decided to create a new "investment vehicle" (aka. a new city) and swap cash for land.
2- We purchased each and all of the land plots there for 6-8 billion$, and plan to sell them piecemeal back to the city, leaving always some 2×2 or 3×3 areas available to corporations to set up retail stores (We miss a click-drag feature to purchase land in bulk). We plan to develop the city.
3- As GDP in the new city grows from very low levels, the land price always starts very cheap but increases very fast.
4- After just three years the effect of the swap has been very positive on our balance sheet. That way we can reach out for extra new bank credit if we need to.
5- The counterparty will be the city's budget first, then the city's creditors.
FINANCES:
Inflation remains at about 5%, and real rates at about 4,5%.
At that price it makes sense to use the bank if we plan to develop new R.E. areas in existing cities, but not to buy land, be it in the outskirts or downtown.
Right now the demand for R.E. isn't growing fast enough to require new credit.
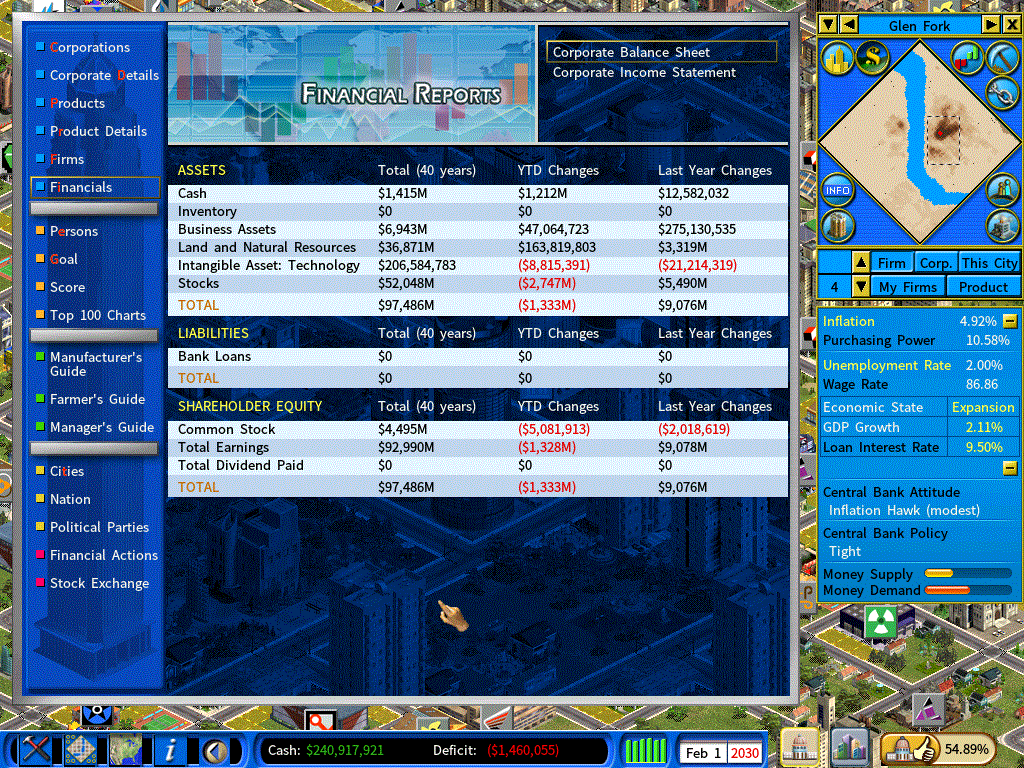
Our Balance Sheet increased 80% since 2025, from 54 billion$ to 97,5 billion$.
23 billion$ derived from the increase in price of our land assets, plus new purchases.
19 billion$ derived from the increase in price of our ownership in performing businesses.
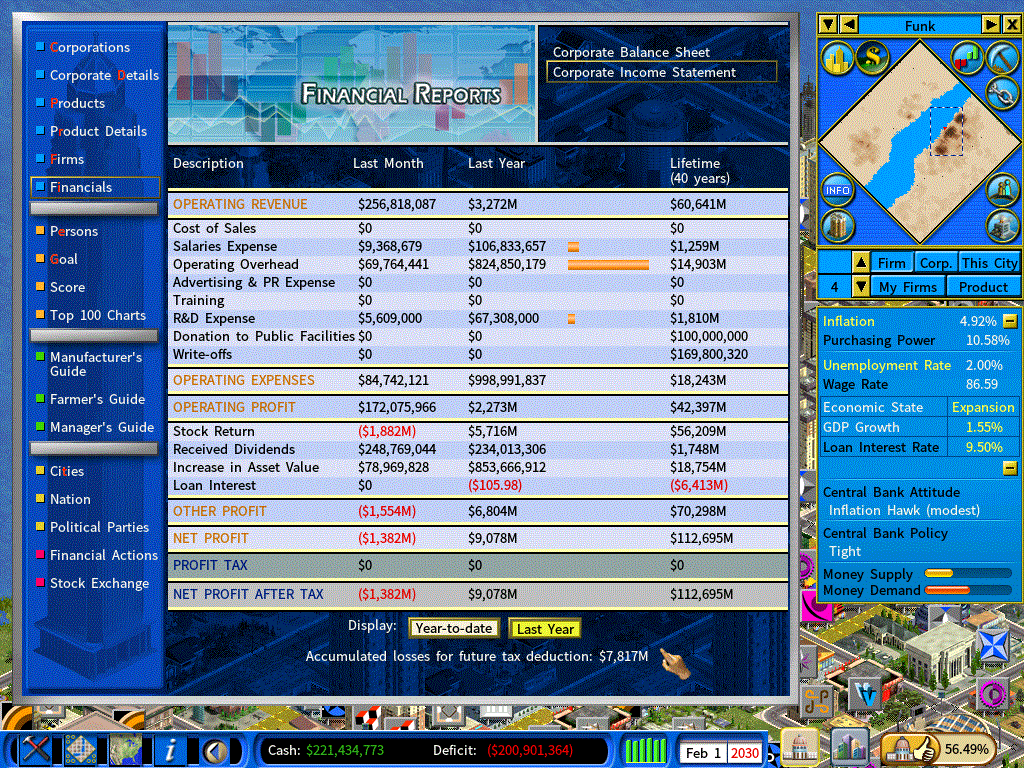
Income is hovering between 1,9 and 2,4 billion$/year. The causes for the fluctuation, we believe, are:
1- Tech sales.
2- New R.E. often operating at a loss for a few years, esp. if the supply is much higher that the demand.
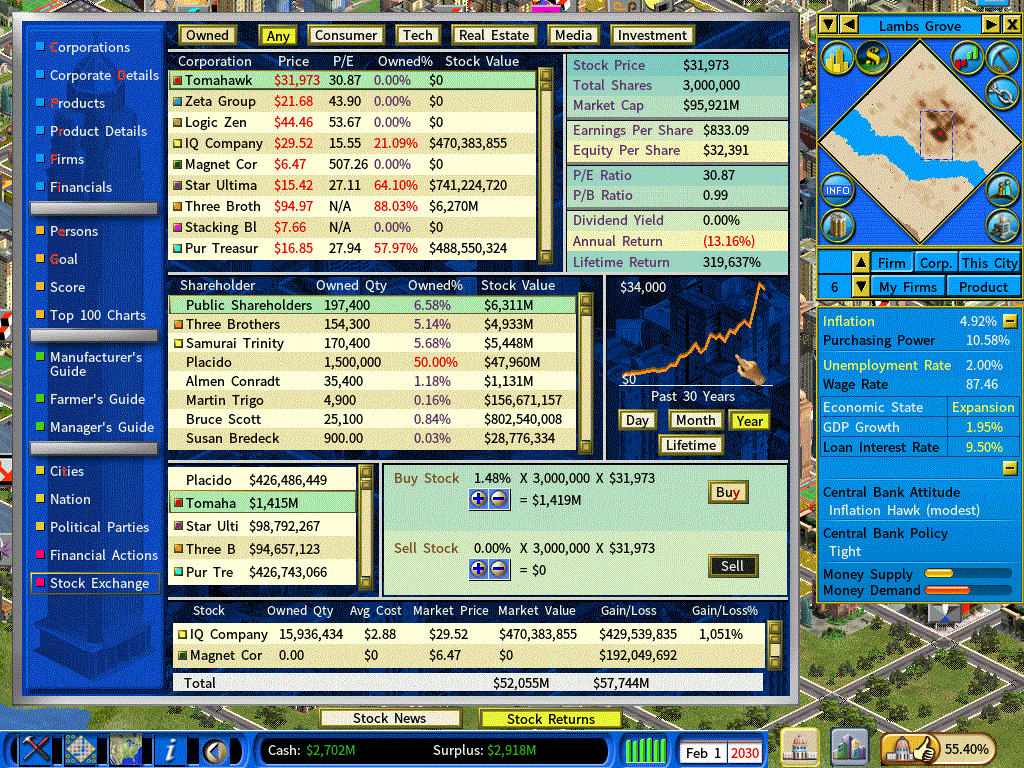
As predicted, the price of our stock increased exponentially during the period.
If it could go from here to the standard 1,4 price to assets that would mean a 45k$/share price.
We mentioned earlier that we'd use the two investment corporations as proxies to invest in our own stock. So, let's throw in some numbers:
3B and SAM, have combined 7,8 billion$ of equity in stocks and combined 10% ownership in Tomahawk. Their combined market cap is 14,5 billion$, from 8,3 billion in 2025 (1,8 price to assets).
Our claims on them are worth 7,4 billion$. We own 88% (from 40% in 2025) of 3B shares and 16% (from 20% in 2025) of SAM shares.
We'll focus on SAM to see if the price becomes cheaper and buy in small additions while keeping an eye at our own valuation.
Also notice a few investors already cashed in and we have 6,5% of the stock "floating" in the hands of public shareholders.
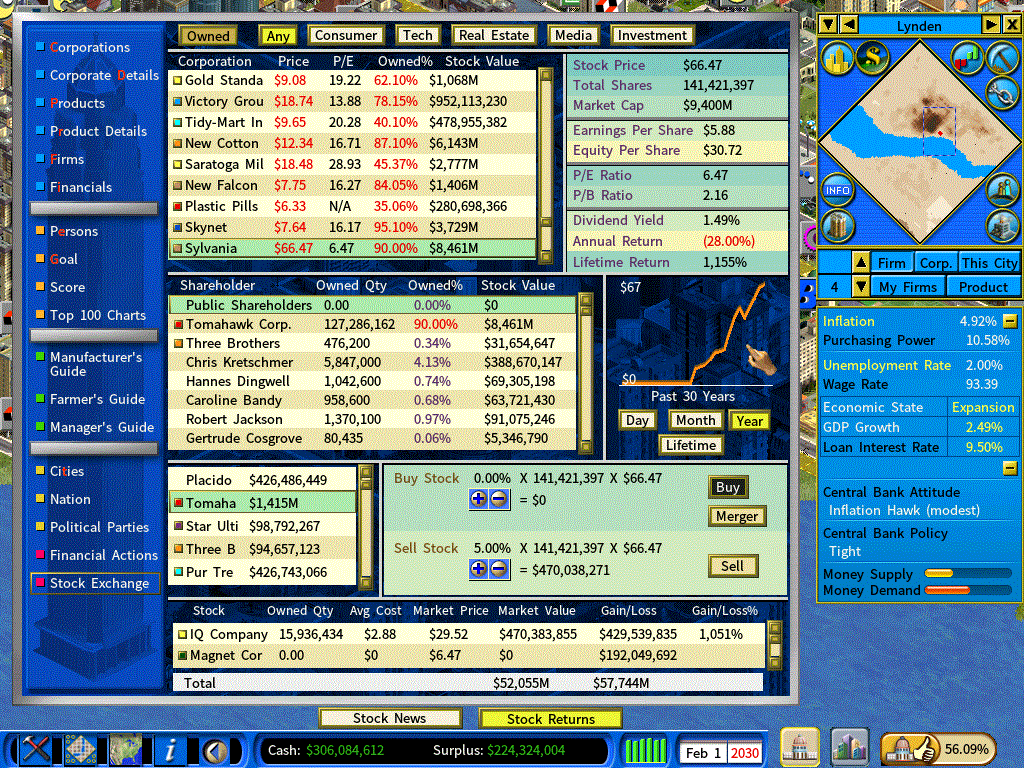
We decided to show here our media monopoly, together with a few of our old subsidiaries, most appearing in the exchange with very nice P/E valuations.
We have been mostly shedding stocks this time. The only acquisitions worth mentioning are an extra 10% in Mankind (toy) and an extra 48% in Three Brothers (investment).
Chapter 72 — 21 June 2020
NEW VENTURES:
Here we have compiled in a snapshot all our PRIVATE subsidiaries and the sectors where we want them to deploy their capital (UPDATED).
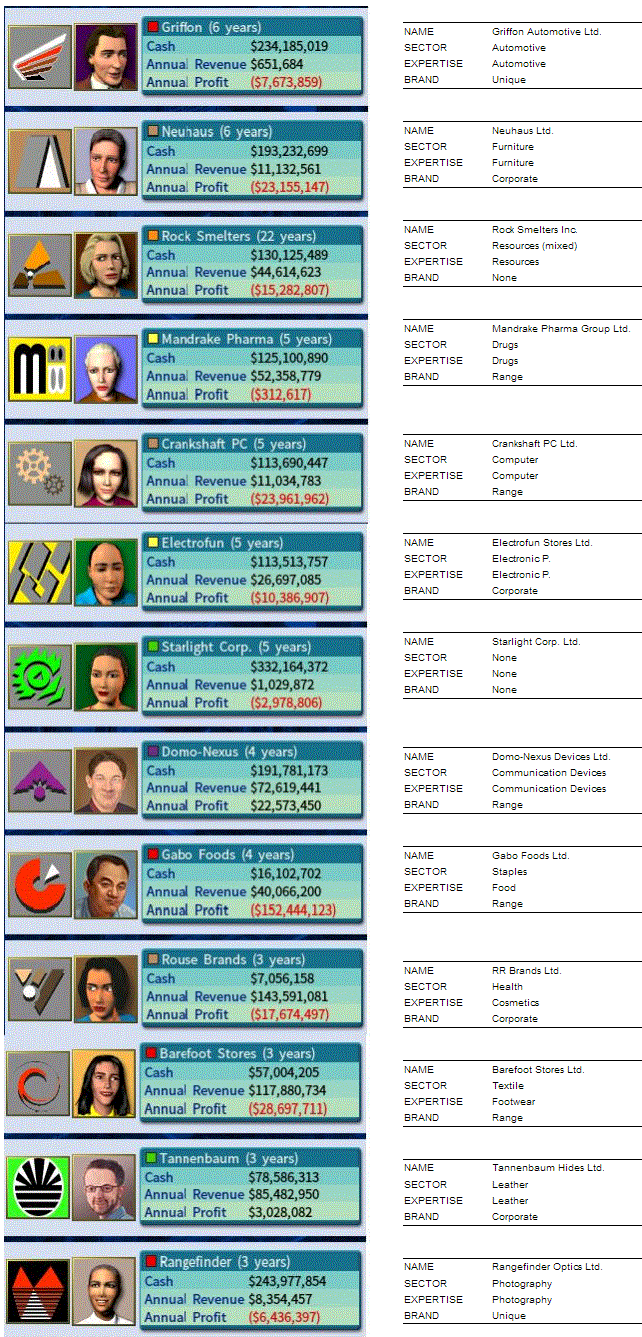
This time we have chosen to avoid the corporate brand strategy, for no particular reason.
In Gabo Foods, RR Brands and Barefoot Stores the costs for building both the BRAND and the updated TECHNOLOGY are quite big (mega-class corporations), so we gave them an extra 500 mm$ after we found them struggling to keep above water.
Moreover, we plan to give these three an extra billion$ going forward, and 500mm$ to the oher nine, as soon as we have the cash to spare.
Starlight Corp: We will use them from now on to sell livestock products in the open market, so we will have to hire a new CEO with farming skills. We allowed them freedom to expand in any sector, but the CEO basically decided to sit back in the HQ after setting up a steel factory. (Ditto about our new automobile subsidiary…)
New project: Kitten&Yarn
We fired Hans Tanaka from his position as CTO in New Cotton Thread a few years ago with the intention to make him CEO of his own corporation.
Up until now, his attitude toward us was very bad and he rejected our offers (it seems to us in-game people are too sanguine about these matters).
As Apparel is an area where our country has potential to increase its exports, Mr. Tanaka's expertise (Apparel) will come hand in glove. We'll provide him with 2 billion$, in a few installments, for the task ahead.
To recap: set up costs and recapitalizations will then be 3×2+9×1+2= 17 billion$ total, of which we have spent 7,5 billion$ so far. That much will suck in about 4 years of our current income.
CORPORATE ENVIRONMENT:
We have upgraded our Corporate Chart.
First of all the corporations have been grouped by sectors of activity.
6 sheets have been added inside the file to make looking through data more accesible.
The first two sheets (PREV & CURR) gather the corporate data from a year of choice. One can switch the year through a tab at the bottom.
If one wants to compare the evolution between these two periods the data will appear in the 3rd sheet (CHG)
The 4th sheet (O.I) shows additional information that can be related to the present time (CURR) or to the difference between the periods, depending on the column.
The 5th sheet (DOM) gives us the "dominance" figures that we provided in previous posts (how much share your GROUP has of a specific corporate metric vs the rest of corporations, like market capitalization, etc.) You have to choose the year in the CURR sheet.
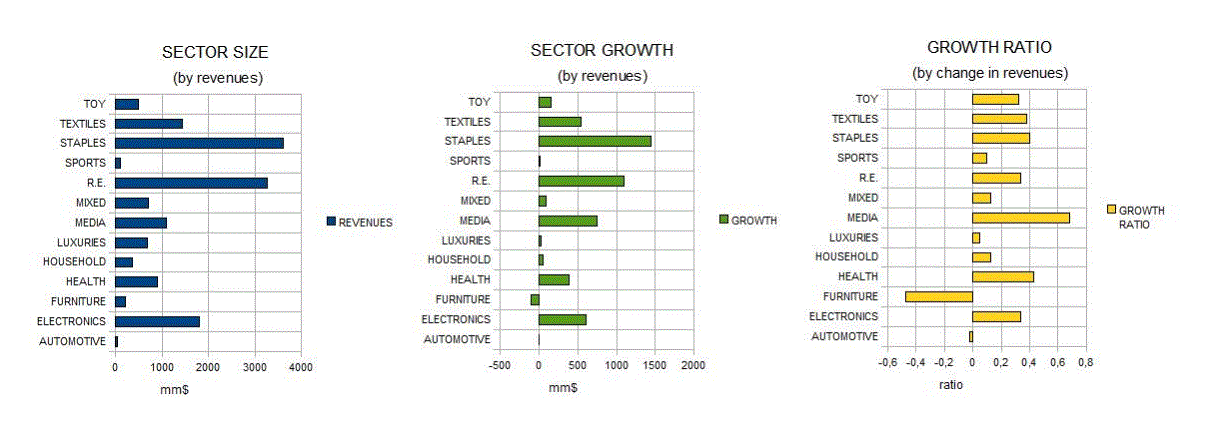
I plan to add a few charts in the 6th sheet (CHRT), but haven't decided yet which ones would be interesting, so I added three "growth" charts by industry sectors for the time being. Feel free to suggest!
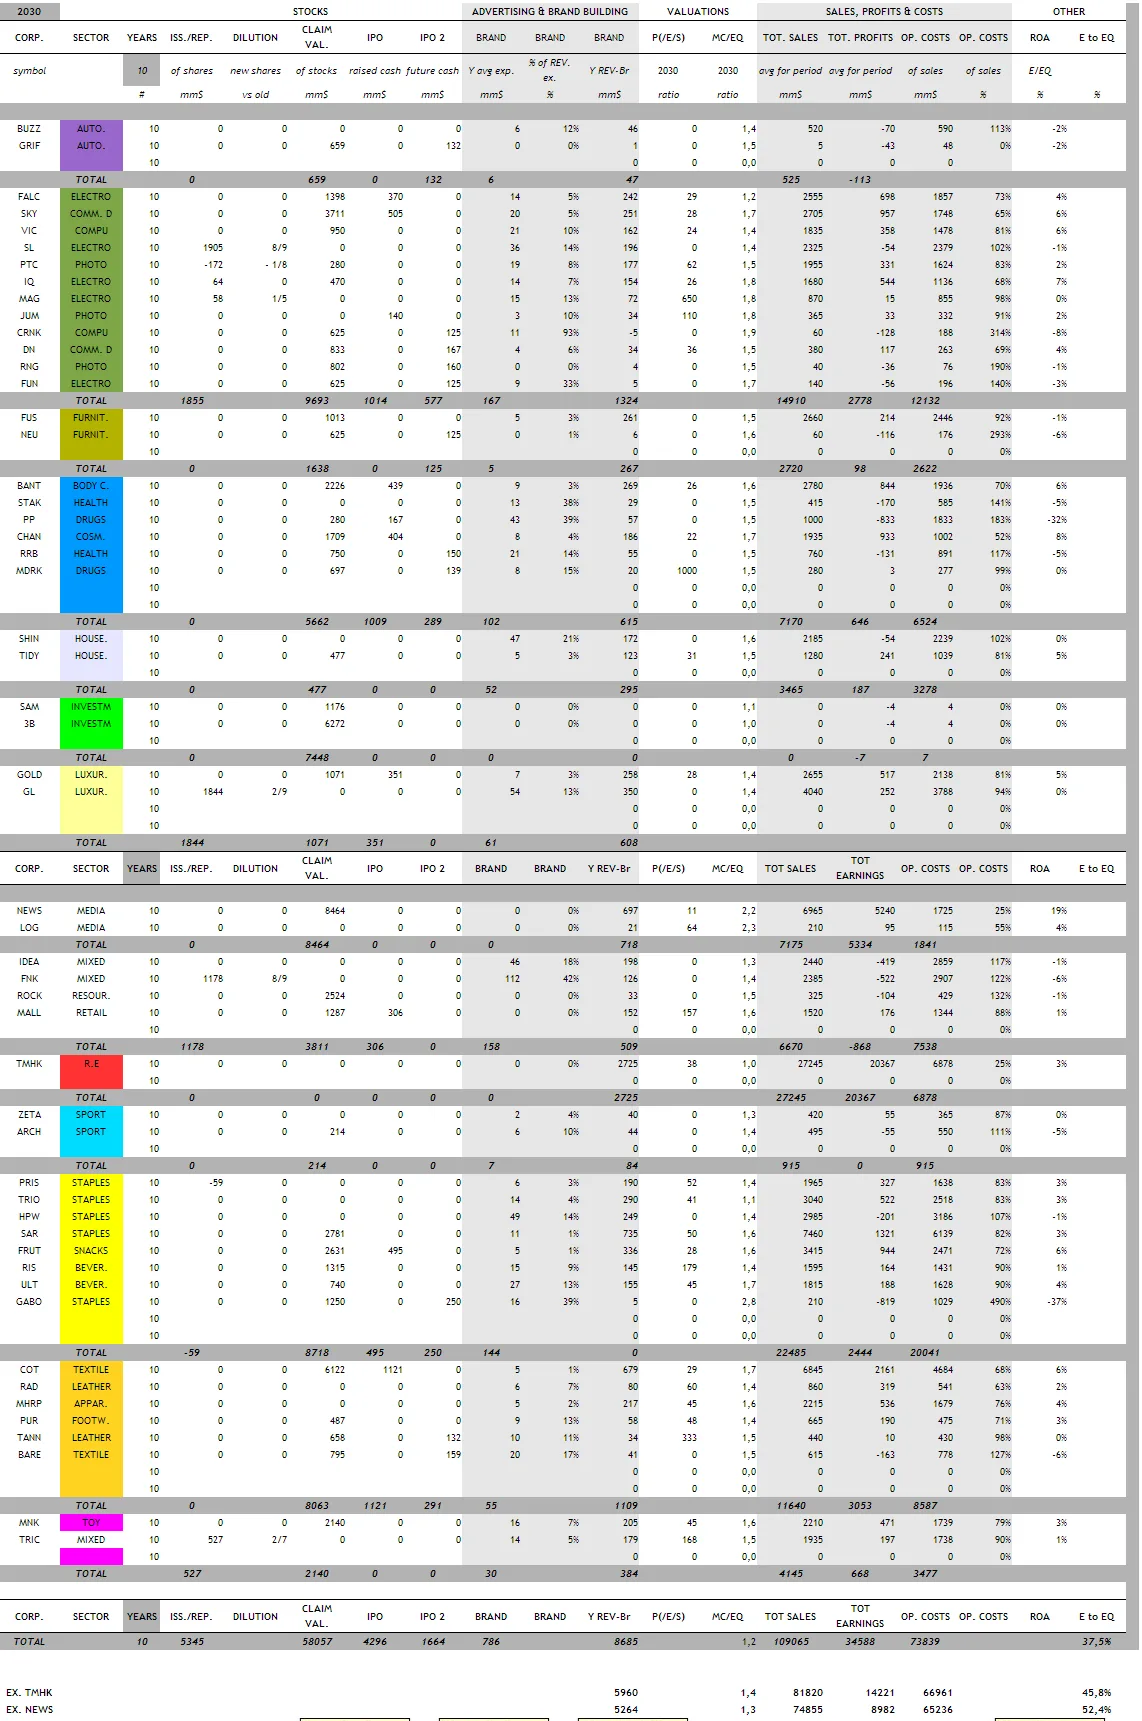
Here's the data for 2030, showing all new subsidiaries except Starlight corp (we forgot about them)…
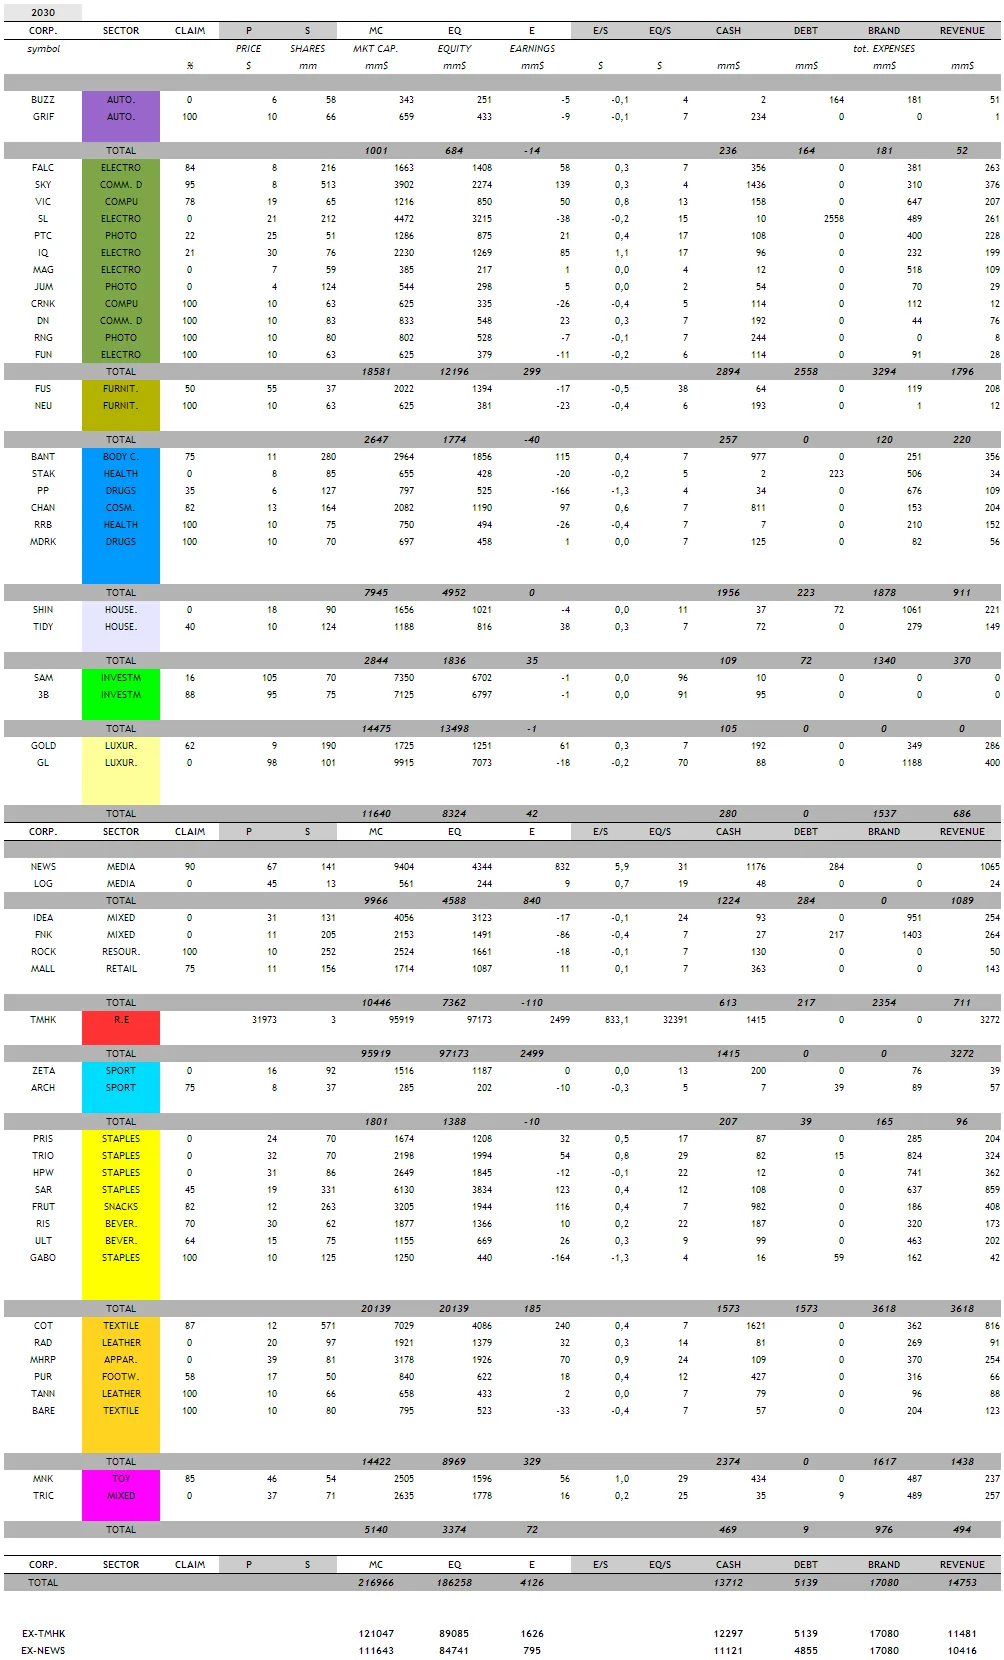
…and the evolution between 2020 and 2030.
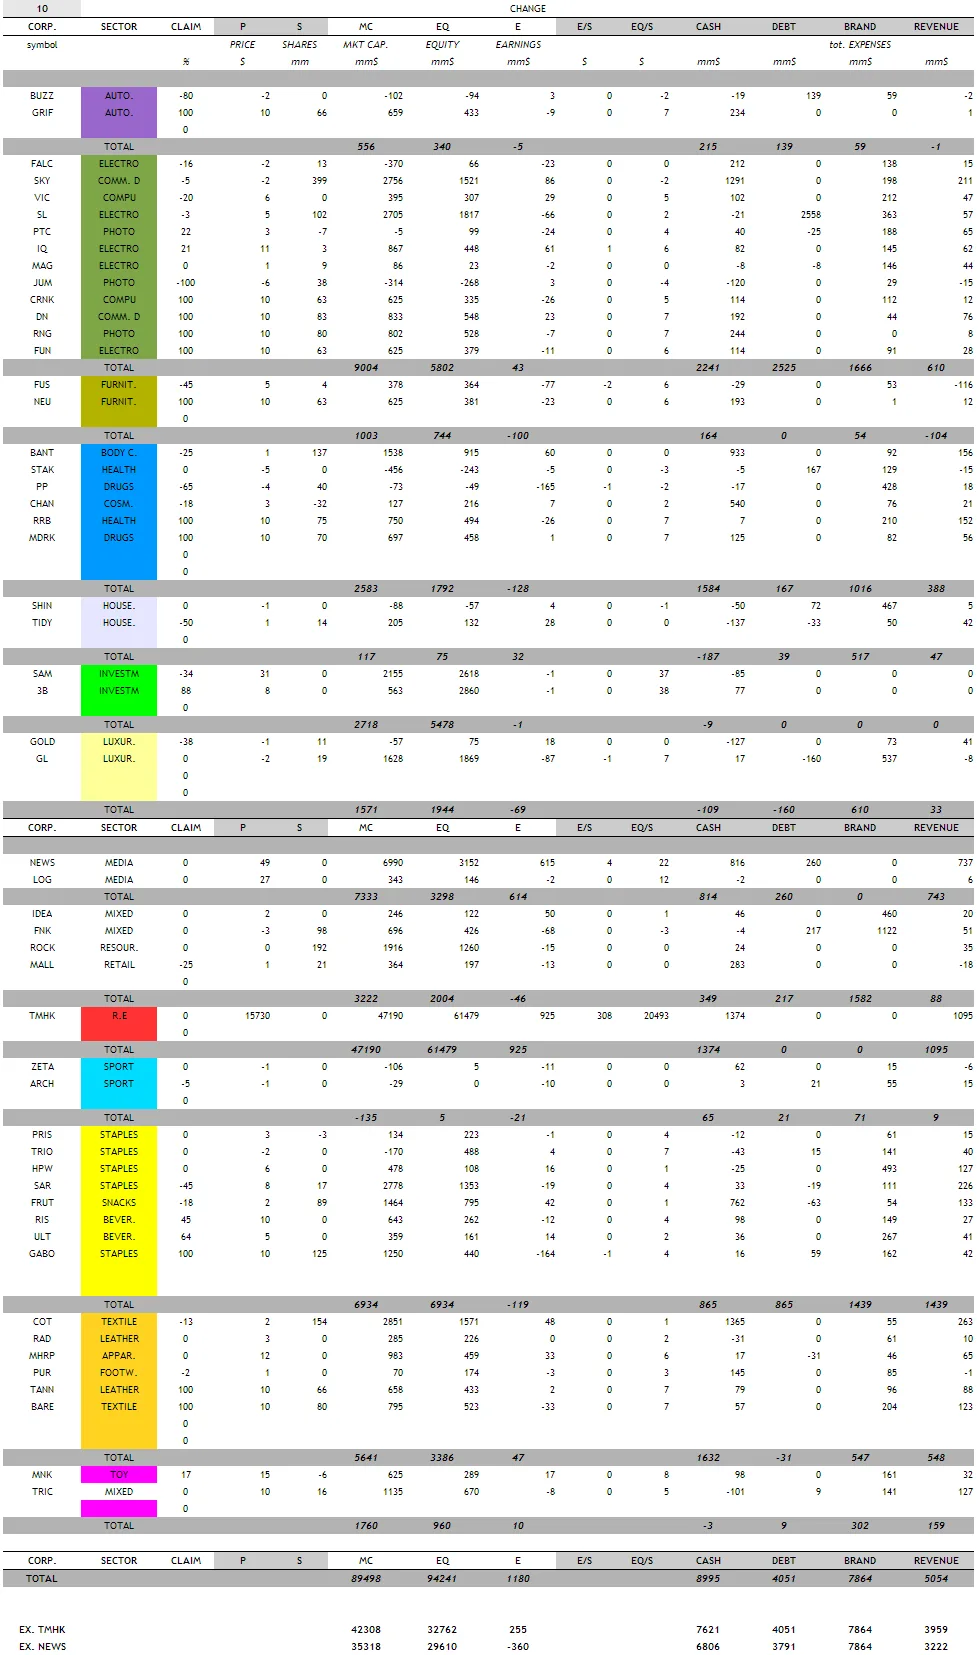
Other information.
Dominance.

Some charts.
Plus the file.
Chapter 73 — 5 October 2020
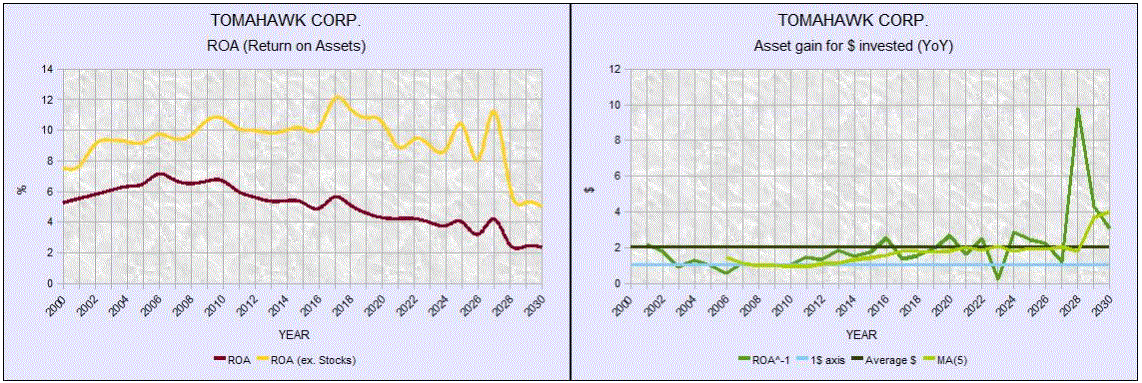
TOMAHAWK CORP. CHARTS:
Here we have a good perspective to see how much we have strengthened our balance sheet, through the creation of a new city (2027) and the building of (too) many apartments. That caused our ROA to drop substantially (not to worry at all!) as our income cannot keep pace with the increase in the value of our assets.
BETTER BRAND APPROACH
We have changed the scope of the brands of some of our new subsidiaries:
After reviewing the current brand cost/profit of some, we decided to RESET 4 brands and choose better sized ones.
The amount has been almost 400 mm$ misspent. The good part is that our newspaper has probably gotten the lion's share of that money.
So our furniture, health, electronics and leather subsidiaries have now corporate brands. (updated the "new ventures" picture).
LAND & R.E.
We have been buying most of the land lots that have been left vacated (unused) downtown where no new firms can be placed, but we will sell these if we can encourage the placement of extra new stores, if the existing ones close down. We believe it's always better that stores are placed side by side because there is a small increase in the customer traffic there, but the AI seems unaware of that peculiarity…
We have also been buying extra land areas in the outskirts, just to help the city budgets.
We built 74 new apartments and 26 office buildings since 2025.
It's all good if you want to inflate the balance sheet, but we mentioned in another post that we are far more interested in increasing our income moving forward.
Vacant buildings have fixed costs too, so we want to keep a good demand/supply ratio: good supply so as to discourage other firms to compete with us but not so much as to have buildings incurring loses. About the demand side, we spent some time looking at population growth to evaluate past and future policy:
Population growth probably is something most people don't pay much attention to, but it's very important. More citizens means a bigger market to sell to, both in R.E. and consumer products.
If population diminishes or their income suffers then the GDP will eventually fall (consumption being the BIG GDP component) and the country will experience a recession.
And we don't want that now.
You probably remember we cut unemployment subsidies a few years back (2020-2022) and we could feel the effects almost immediately as (just a few!) people migrated.
Also, new people are one of the sources of liquidity in the game and we surely don't want to undergo dry periods, esp. if leveraged.
So! we created new charts. Let's see.
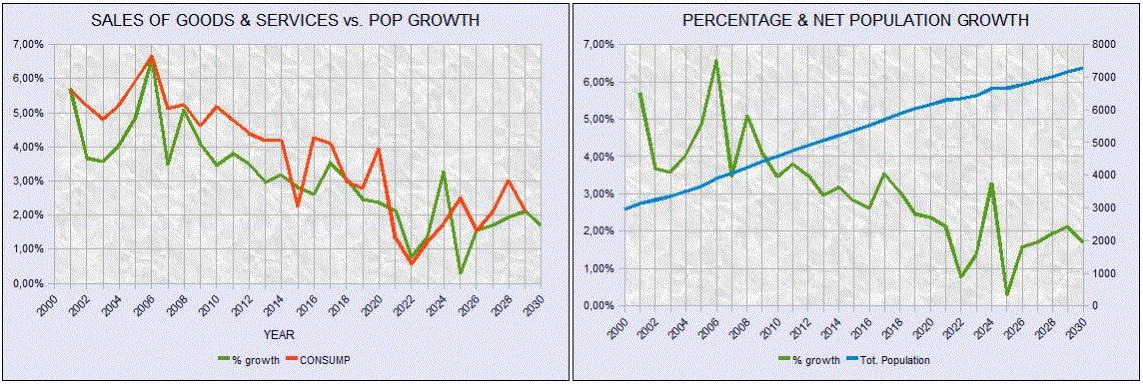
1- We see that the population is still growing (blue line). "Natural" (national) growth is minuscule, but we have an "open city borders" approach, so the vast majority of the new population comes from the countryside or abroad (we are guessing here where from).
2- As city border controls allow just a fixed number of people, as population overall increases in net terms, growth decreases in percentage terms as time goes by. Hence the problem!
3- We have also put together pop. growth and GDP growth to see the strong correlation. Will these small numbers force a recession in the future? We are probably starting to walk the plank…
Another chart here gives us perspective to see the level of past and present "spending power" of households (orange line).
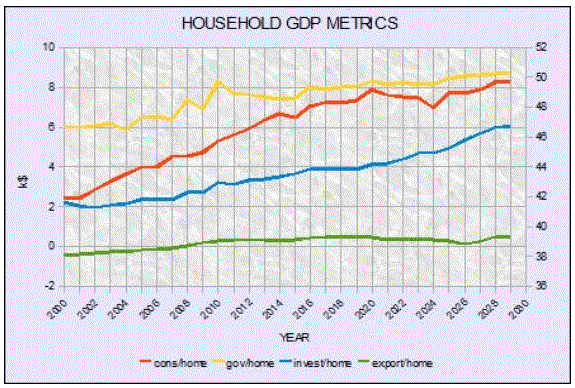
If households will spend even more with every passing year the problem of the smaller-population-growth-in-percentage-terms could be avoided. Unfortunately, we see that since 2020 it's flatlined at about 49k$. We'll see.
We will use the opportunity this chart gives us to very briefly comment the government section, but before let us throw in some numbers about the current supply of apartments:
1- One of our apartment buildings can home about 15k people.
2- The average inflow of new residents is about 144k/year. That means a demand of about 10 new apartment buidings per year to house them.
3- We have a population of 7,3 million and 526 apartment buildings. That means we have a surplus of about 40 apartment buildings.
4- The supply of apartments is greater in some cities, so it will take longer that 4 years to "fill" the current stock.
5- Bottom line: to improve our profits we have to let existing buildings increase their current occupation.
GOVERNMENT & NATION:
We see the yellow line has remained about the 8k$ mark since 2010, meaning the city spends 8k$ per household of 4 in public services every year. Good news indeed! we have been increasing the quality of life without extra spending for 20 years. To achieve that we have just built education and (some) sports & recreation facilities (we are very interested in increasing the appeal of our residential blocks). That also means we have an extra tool to prevent a recession: increase govt. spending. To that end we would have to raise taxation, but we believe people will be able to accommodate to the extra burden if the situation so demands (we have good income&jobs ratings).
We will increase taxes a bit anyway just now as from Tomahawk Corp. we are a bit fed up with our policy of having to buy land as a loan to the people of Sylvania, in detriment to our shareholders.
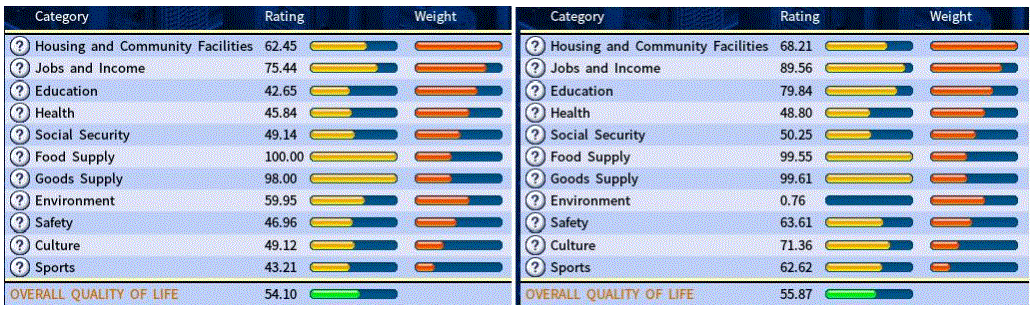
We also provide the GDP chart group that we monitor.
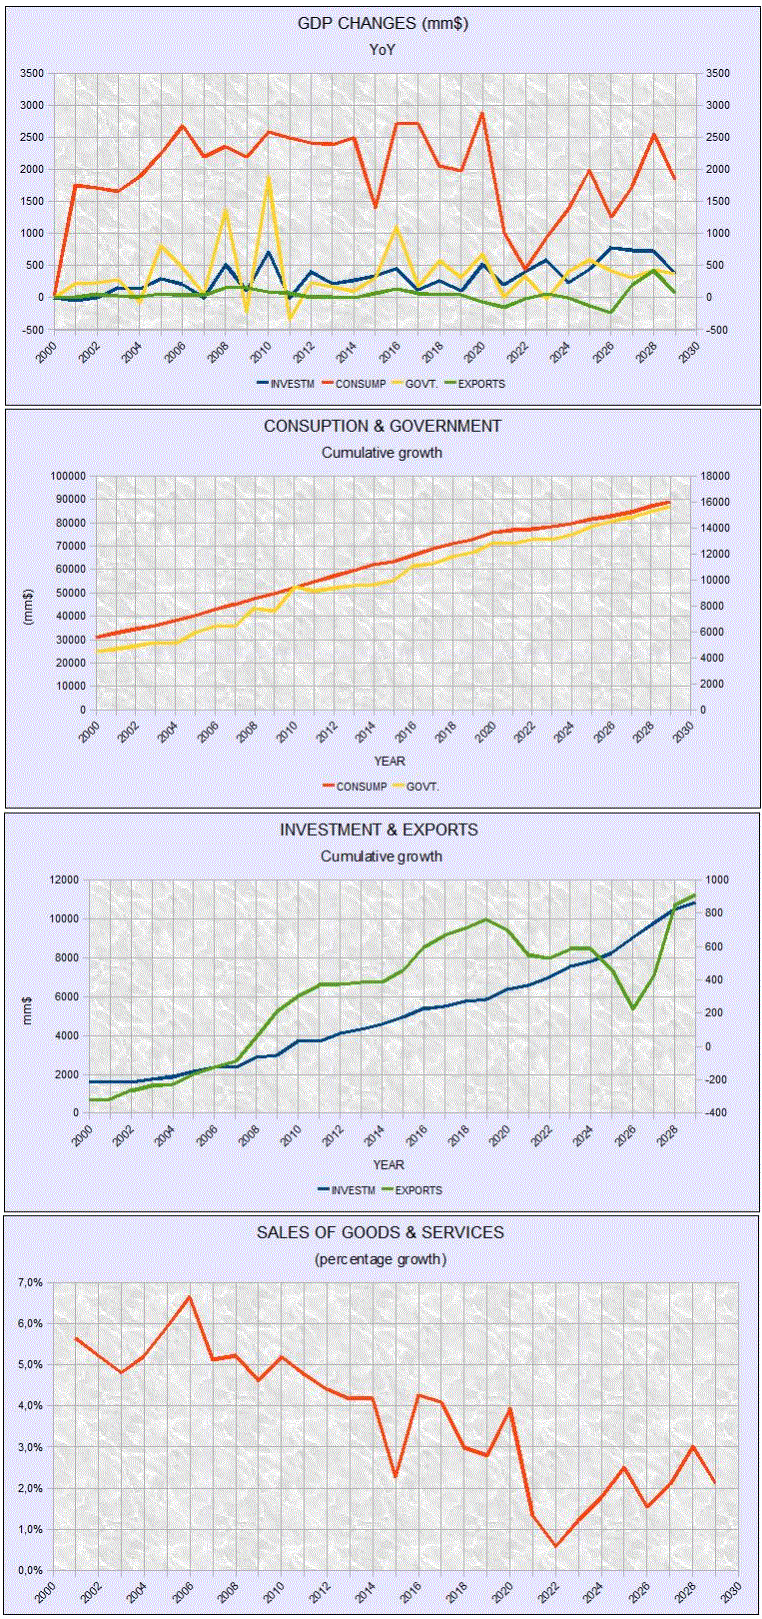
Notice that after we reverted our policy of no subsidies (the debacle), sales of goods&services went from almost 0,5% to a decent 2,5% increase YoY.
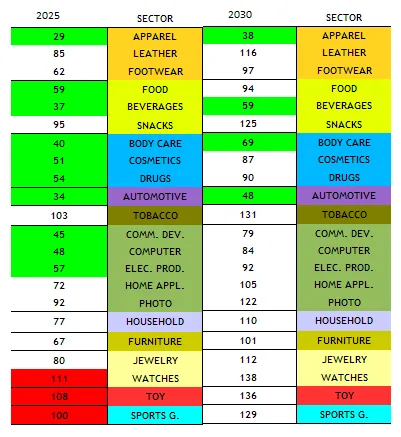
Also, our policy of investing in research of the weakest global sectors has succeeded in boosting exports since the last reporting period (2025, blue line). Nevertheless, we put together the 2025 and 2030 ratios of global competitiveness, and surprisingly, in just 5 years the rest of the world is showing a very strong increase in the appeal of most of their product categories. We haven't calculated the increase but you'll agree it's been quite remarkable.
To end this section, just mention that both Funk and Glen Fork had to issue loans for 250mm$ each. Lambs Grove and Lynden have no outstanding debts.
PLANNING AHEAD:
We will play till 2040 this time.
Our main immediate focus will be the recapitalization of our new ventures and the creation of a new textile subsidiary with Hans Tanaka as CEO. We will provide them the cash as has been planned, in small installments, for the first 4-5 years. In the meantime we'll let our apartments increase their level of occupancy.
We'll open up a new residential area downtown in FUNK where we see too many factories too close to public facilities, and build our future apartments there. New Funk has been a success.
We'll increase the size of the industrial parks as some are almost filled up (FUNK). If the cities need short term "loans" Tomahawk will buy parts of these expansions and resell them "as needed" to any manufacturer that demands it. We'll create agricultural areas in Lambs Grove and Glen Fork to encourage farming. Not in Funk (overflow issues).
We'll take the reins of our automotive subsidiary (Griffon Ltd.) to see how bad prospects the business has, that the CEO just sits in the HQ. We'll link our manufacturing units with Buzzard Automotive's production plants as they have good quality components. We'll start purchasing shares in Buzzard if we can successfully sell enough Griffon cars.
If we have cash to spare we'll purchase Saratoga Mills (FOOD) shares until we make them our subsidiary again.
We'll increase income taxes and sell first our land in the periphery, then downtown, as the city budgets improve.
We'll use our cash rich subsidiaries to buy the stock of their competitors if we judge there's a good risk of these going bankrupt. No more chaos mergers!
And, hopefully, no new ventures: we have a lot of these already.
See you soon!